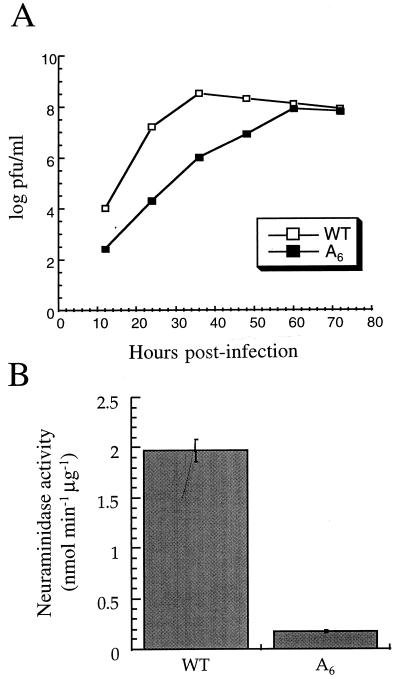
FIG. 4.
The A6 mutant is attenuated due to the reduction of NA expression. (A) Growth curves of transfectant viruses on MDBK cells. Cells were infected with the wild-type virus (WT) or the A6 mutant (A6) at an MOI of 0.01. Infectious particles released into the media at the indicated time points were titrated by plaque assay of MDBK cells. (B) NA activities of wild-type virus and the A6 mutant. NA activity was expressed as nanomoles of 4-methylumbelliferone released per minute per microgram of viral protein. (C) NA protein expression in infected cells. Cells infected with the A6 mutant (a and b) or the wild-type virus (c and d) and mock-infected cells (e and f) were tested for NA protein expression. NA protein expression was visualized by fluorescence microscopy with a fluorescein isothiocyanate (FITC)-labelled antibody. Cells were mounted in antibleach medium containing DAPI for DNA staining. The merged images of NA protein expression and cell nuclei (b, d, and f) are shown. Note that not all cells were infected with virus.


