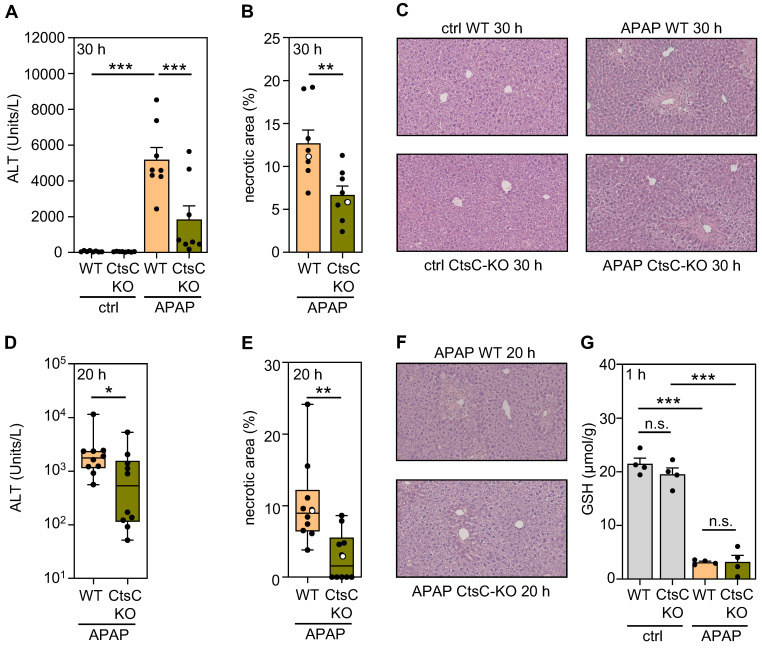
Figure 2.
CtsC-deficient mice display ameliorated APAP-induced ALI. Male WT and CtsC-deficient (CtsC-KO) C57BL/6J mice received either 0.9% NaCl (ctrl) or APAP (300 mg/kg) (A-C, G) or APAP (300 mg/kg) (D-F). After 30 h (protocol I) (A-C), 20 h (protocol II) (D-F), or 1 h (G) hepatic tissue and serum was analyzed. A, D Serum ALT levels were measured after 30 h (A, n = 8 for each group; ***p < 0.001) or 20 h (D, n = 10 for each group; *p < 0.05). B, E Quantitative analysis of necrotic areas in H&E-stained liver sections obtained from APAP-treated mice at 30 h (B, n = 8 for each group; ** p < 0.01) or 20 h (E, n = 10 for each group; ** p < 0.01). C, F Representative images of H&E-stained sections at 30 h (C, ctrl and APAP-treated groups) or 20 h (F, APAP-treated groups). Selected specimens from APAP-treated groups shown as representative are highlighted as white circles in the corresponding subfigures (B, E). G Levels of GSH were determined in liver homogenates (n = 4 for each group; ***p < 0.001). Statistical analysis: A, G, raw data were analyzed by one-way ANOVA with post hoc Bonferroni correction and are shown as means ± SEM; B, raw data were analyzed by unpaired Student´s t-test and are shown as means ± SEM; D-E, raw data were analyzed by Mann-Whitney-U-test and are shown as boxplots. n.s., not statistically significant.

