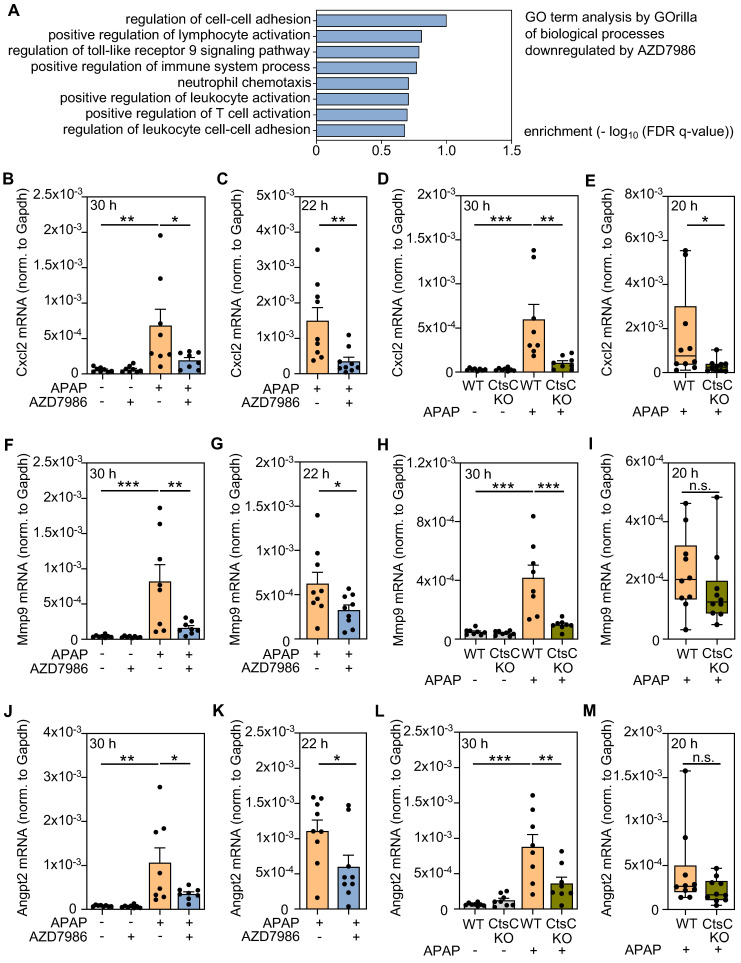
Figure 4.
Analysis of hepatic gene expression during APAP-induced ALI as detected under the influence of AZD7986 or in CtsC-deficient mice. A-B, F, J Male WT C57BL/6J mice received, in the prophylactic treatment protocol III (n = 8 for each group) (see Figure 3A), either 0.9% NaCl (ctrl), or 0.9% NaCl + AZD7986 (5 mg/kg), or APAP (300 mg/kg), or APAP (300 mg/kg) + AZD7986 (5 mg/kg). Groups not treated with AZD7986 received four administrations of vehicle-AZD7986. A After 30 h (protocol III), hepatic RNA was pooled (per experimental condition) in equal shares and evaluated for gene expression by MACE. GO term analysis was performed on 2135 genes significantly downregulated by AZD7986 in APAP-treated mice (by at least 50%) using GOrilla. Shown are biological processes significantly downregulated (p < 0.001) by AZD7986 that relate to necroinflammation/immunoregulation. B, F, J After 30 h, hepatic mRNA expression of Cxcl2 (B), Mmp9 (F), and Angpt2 (J) was quantified using realtime PCR. Target mRNA normalized to Gapdh is shown as absolute values (*p < 0.05, **p < 0.01, ***p < 0.001). C, G, K Male WT C57BL/6J mice received, in the therapeutic treatment protocol (see Figure 3E), either APAP (300 mg/kg) + vehicle-AZD7986, or APAP (300 mg/kg) + AZD7986 (5 mg/kg). After 22 h (protocol IV), hepatic mRNA expression of Cxcl2 (C), Mmp9 (G), and Angpt2 (K) was quantified using realtime PCR. Target mRNA normalized to Gapdh is shown as absolute values (n = 9 for each group; *p < 0.05, **p < 0.01). D-E, H-I, L-M Male WT and CtsC-KO C57BL/6J mice received either 0.9% NaCl (ctrl) or APAP (300 mg/kg) with n = 8 for each group (D, H, L) or APAP (300 mg/kg) with n = 10 for each group (E, I, M) (see Figure 2). After 30 h (D, H, L, protocol I) or 20 h (E, I, M, protocol II), hepatic mRNA expression of Cxcl2 (D-E), Mmp9 (H-I), and Angpt2 (L-M) was quantified using realtime PCR. Target mRNA normalized to Gapdh is shown as absolute values (*p < 0.05, **p < 0.01, ***p < 0.001). Statistical analysis: B, D, F, H, J, L, raw data were analyzed by one-way ANOVA with post hoc Bonferroni correction and are shown as means ± SEM; C, G, K, raw data were analyzed by unpaired Student´s t-test and are shown as means ± SEM; E, I, M, raw data were analyzed by Mann-Whitney-U-test and are shown as boxplots; n.s., not statistically significant.

