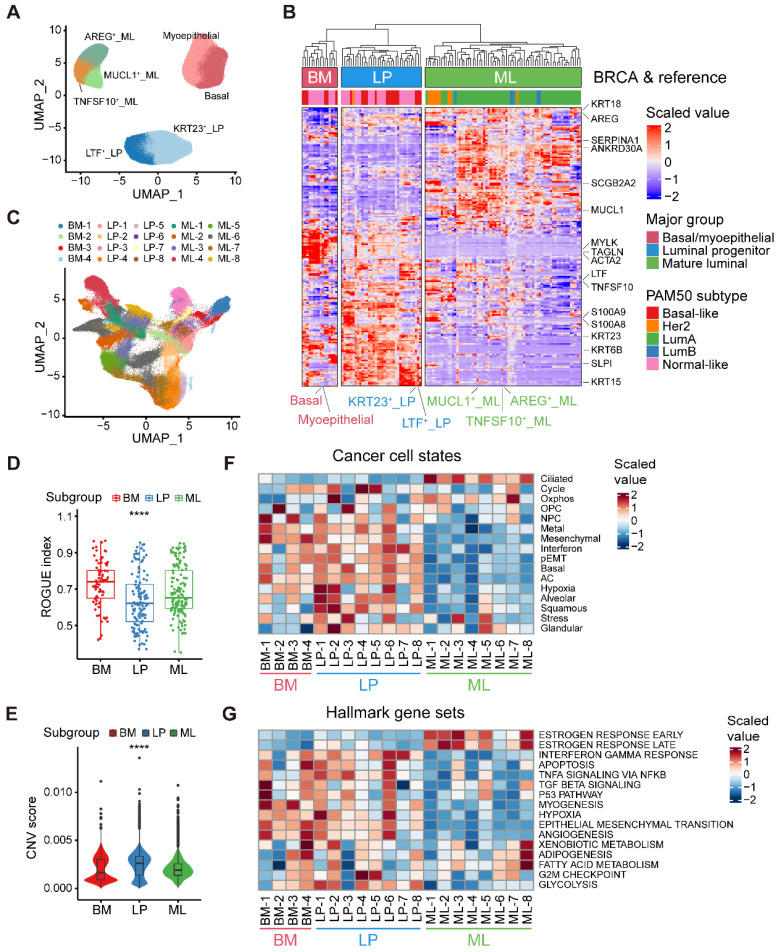
Figure 2.
Alignment of breast cancer cells to normal breast epithelial cell subtypes. (A) UMAP plot showing the major lineages of epithelial cells in normal breast tissues. (B) Clustering of 115 breast tumor pseudobulk profiles combined with seven reference normal mammary epithelial pseudobulk profiles showing three major lineages based on the expression of common signature genes. (C) UMAP plot showing 20 breast tumor subpopulations within three major lineages of breast cancer cells. (D) Boxplot showing cell purity for breast cancer cells within three major lineages. Kruskal-Wallis test. (E) Violin plot showing distributions of CNV scores among breast cancer cells from three major lineages. Kruskal-Wallis test. (F) Heatmap showing different expression patterns of 16 recurrent cancer cell gene modules among 20 breast tumor subpopulations. (G) Heatmap showing different expression patterns of hallmark gene sets among 20 breast tumor subpopulations.

