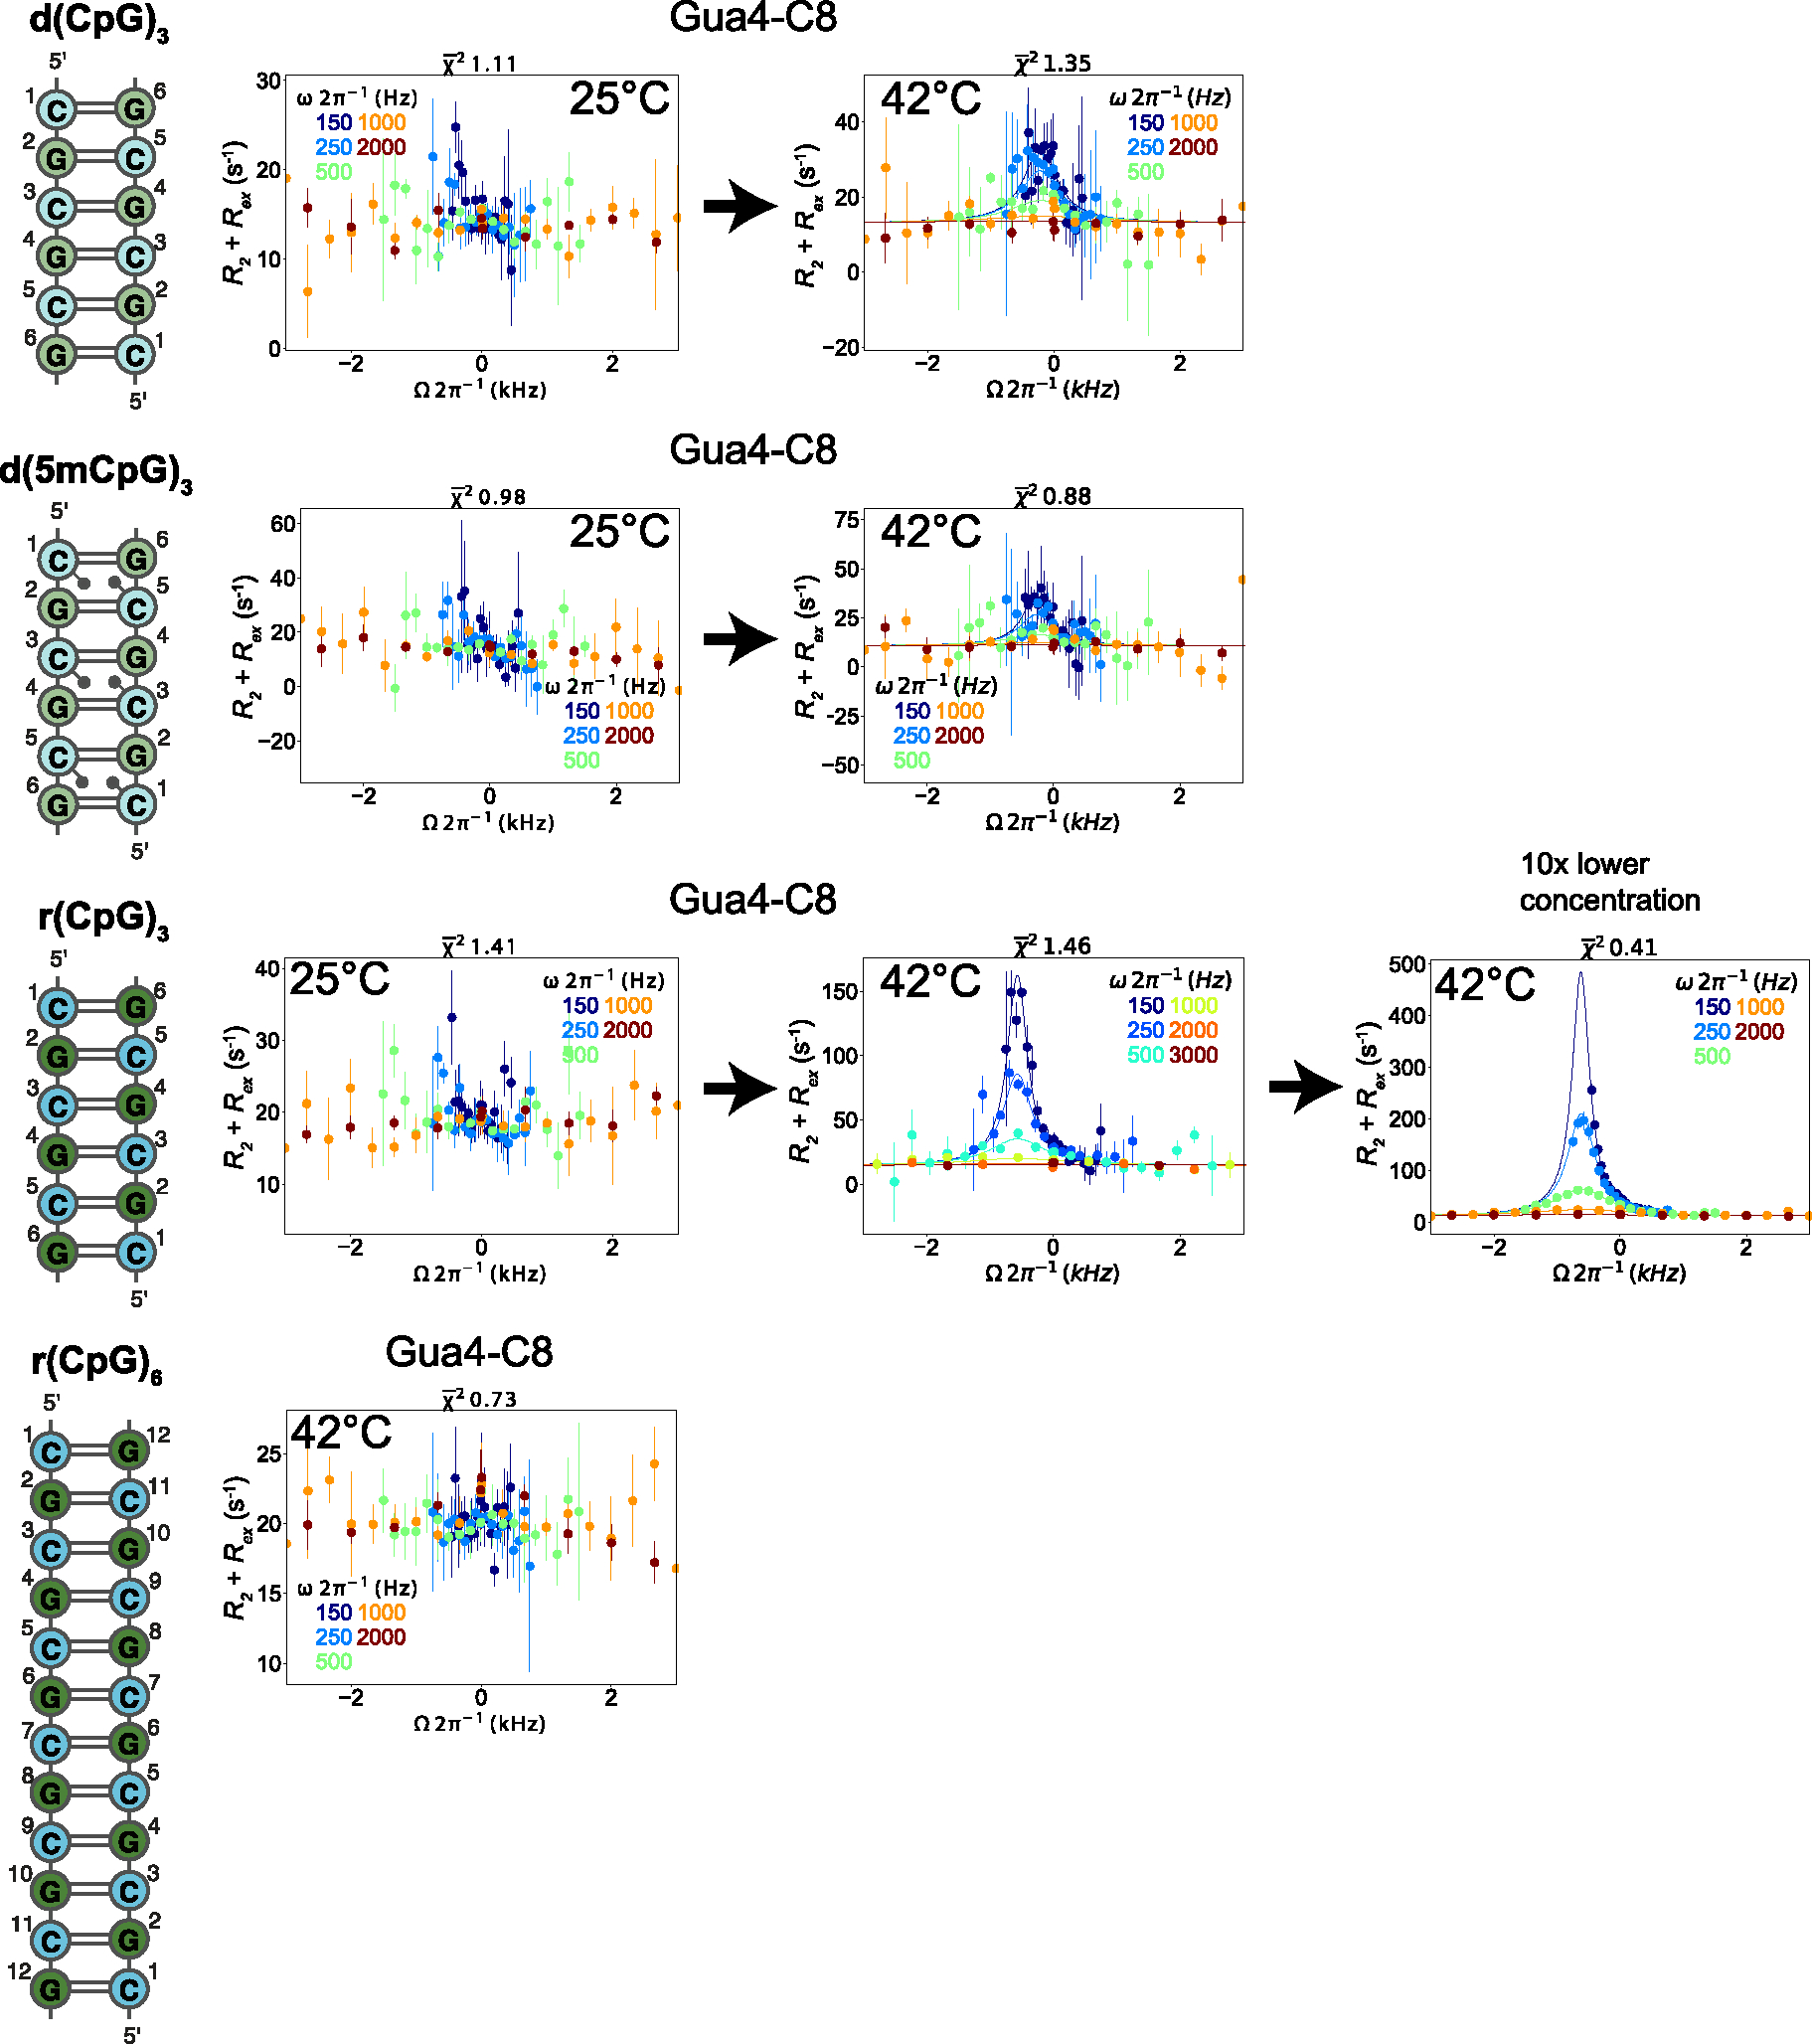
Figure 4.

Off-Resonance R1ρ relaxation dispersion profiles of the different DNA and RNA constructs at 25°C and 42°C. 2D representations of the d(CpG) and r(CpG) constructs and corresponding Off-Resonance R1ρ relaxation dispersion profiles for the C8 atom of Gua4 carried out at five different spin-lock powers (150, 250, 500, 1000, and 2000 Hz, colored coded according to the legend within each plot) at 25°C and 42°C are shown to the right. The dispersion profile at 10x lower concentration of duplex for the r(CpG)3 construct is also shown. R2 + R2ex (= (R1ρ – R1cos2θ)/sin2θ, where θ = tan−1(lock power/offset)) values are given as a function of the resonance offset from the major state (Ωoff/2π). Error bars represent experimental uncertainty from a bootstrapping method, as described in the Methods section. The fits (solid lines) were carried out as described in the materials and methods, and fitted parameters are found in Tables 2 and 3.
