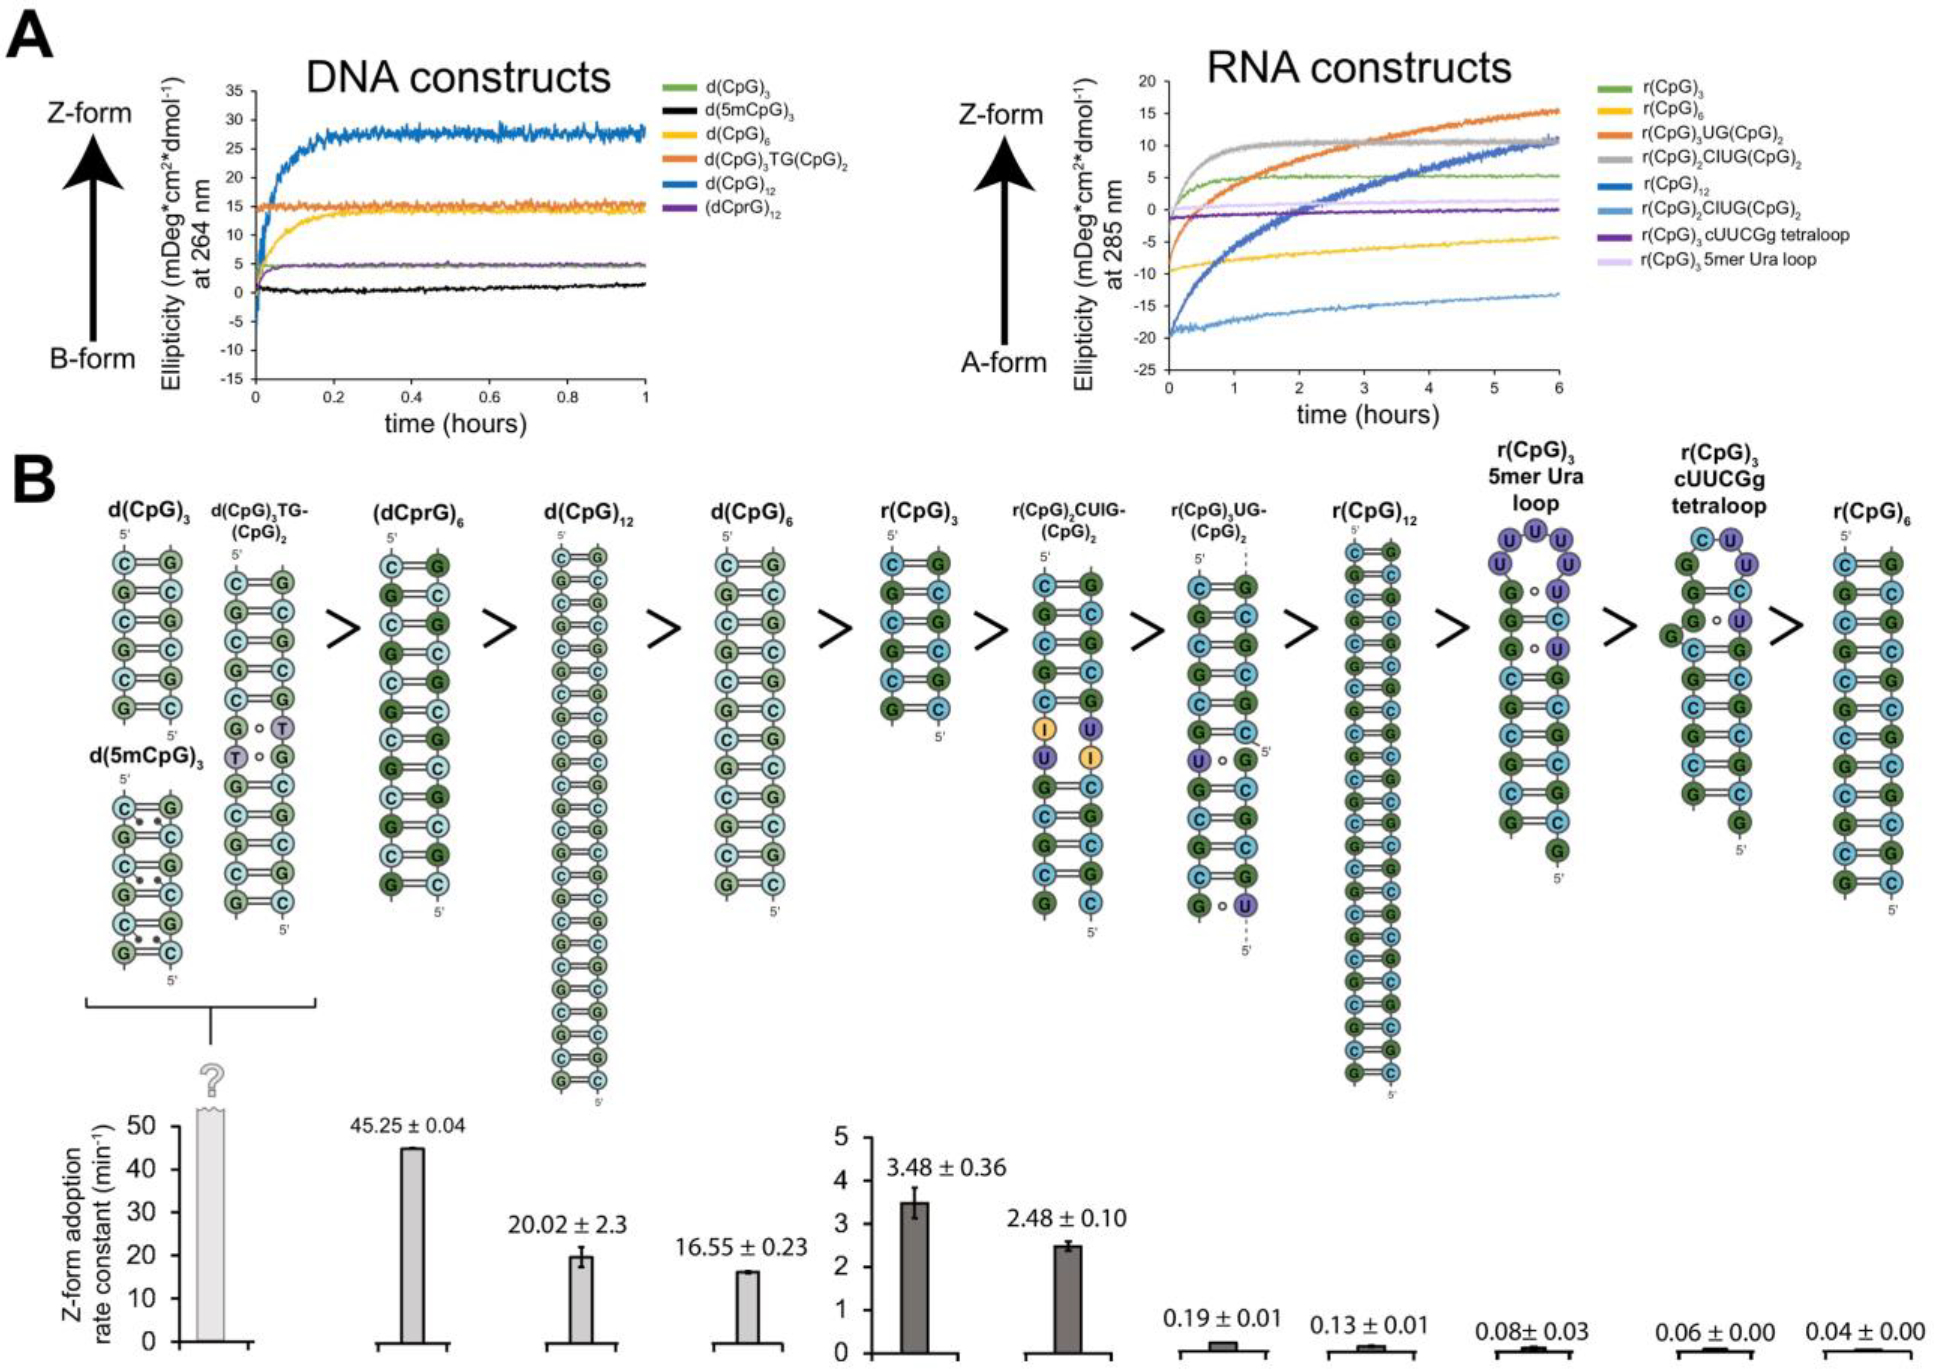
Figure 7.

Z-form adoption rates in DNA and RNA constructs. (a) Circular dichroism time-course experiments showing the rate of Z-DNA (tracked at 266 nm) and Z-RNA (tracked at 285 nm) adoption after the addition of saturating concentrations of Zα at 25°C. The different constructs are color-coded according to the legend on the right-handed side. (b) 2D depictions of DNA and RNA constructs (above) are shown in descending order according to their Z-form adoption rates at 25°C (below), with their half-times indicated in minutes.
