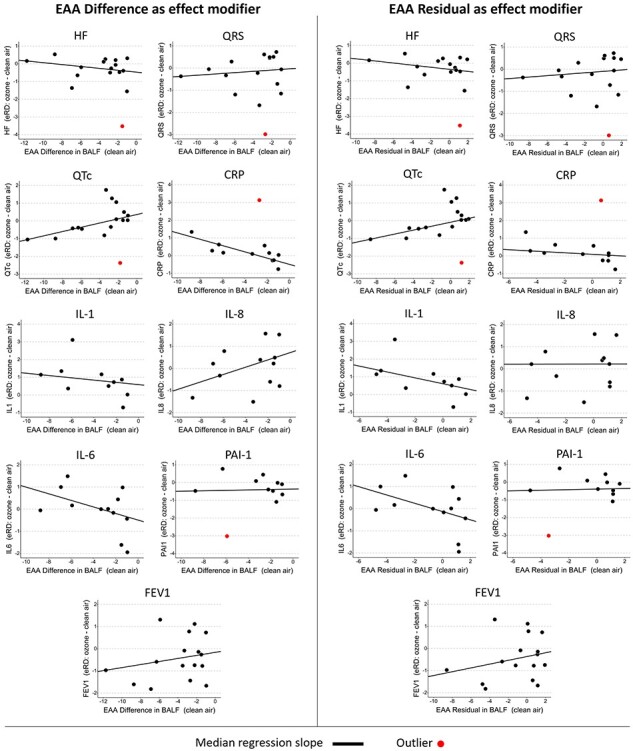
Figure 2:

Scatterplots illustrating the median regressed relationship between the EAA Difference and the eRD of each subclinical outcome. Plots lacking a red line did not contain an outlier point. Abbreviations: HF, high-frequency heart rate domain; QRS, QRS wave complexity
