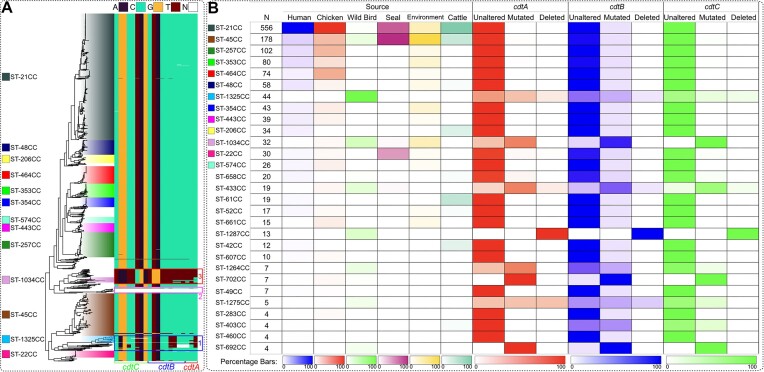
Figure 4.
Overview of allelic variation of CDT subunits in the C. jejuni dataset. (A) The phylogenetic tree (n = 1480) is coloured according to the clonal complex and the key to the left of the tree is labelled according to the corresponding topology of each clonal complex. Allelic variation of the three CDT subunits (CdtA, CdtB and CdtC (x axis)) encoded by the cdtABC operon across the tree is represented by the heatmap to the right of the tree. (B) The association of a particular clonal complex with a source is highlighted by the first panel. The darker the shading (explained by percentage keys at the bottom of the panel), the higher the percentage of isolates from each source belonging to the particular clonal complex (rows). The rows are ordered by abundance (column N) in the C. jejuni dataset. Three panels to the right represent the allelic variation within CdtA (red), CdtB (blue) and CdtC (green) subunits. The shading represents the percentage of isolates associated with a particular clonal complex/source with either: 1) the unaltered allele; 2) a nucleotide change (mutated); or, 3) a deletion of the CDT subunit. Shaded keys at the bottom of the three panels represent the percentage of isolates.

