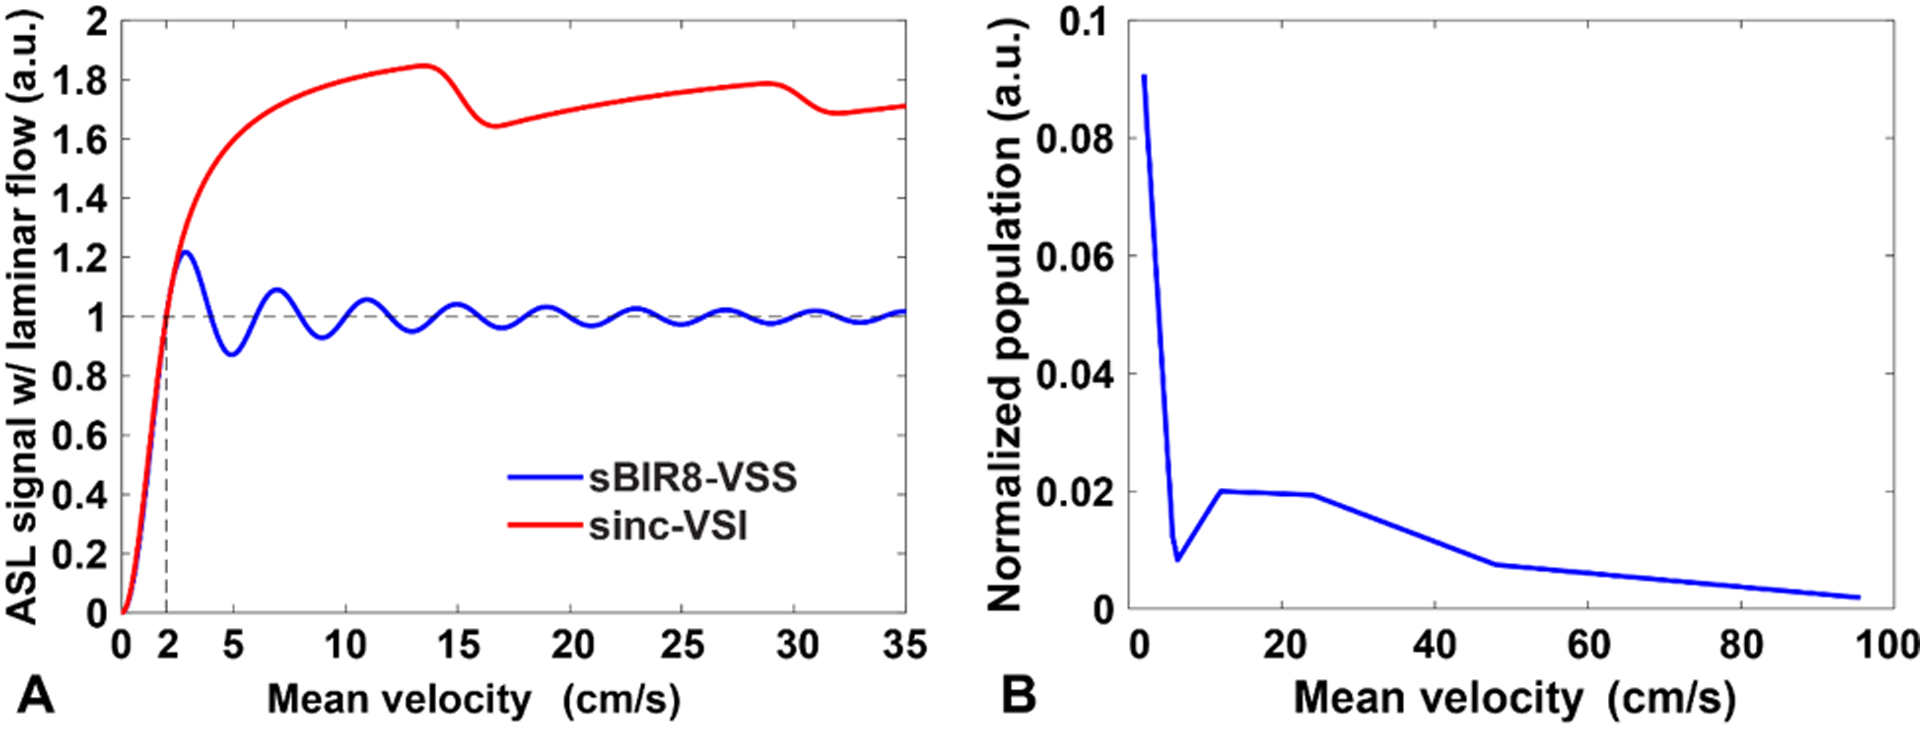
Figure 2:

(A) The SigASL-Vmean profiles for the VSS and VSI labeling after convolving with a laminar flow distribution, showing the definition of the cutoff velocity (e.g. 2 cm/s); (B) the arterial blood population distribution obtained experimentally. Linear interpolation was used to estimate the population over the range of 2 – 96 cm/s of mean velocity. Note the well-matched cut-off profiles between VSS and VSI pulses.
