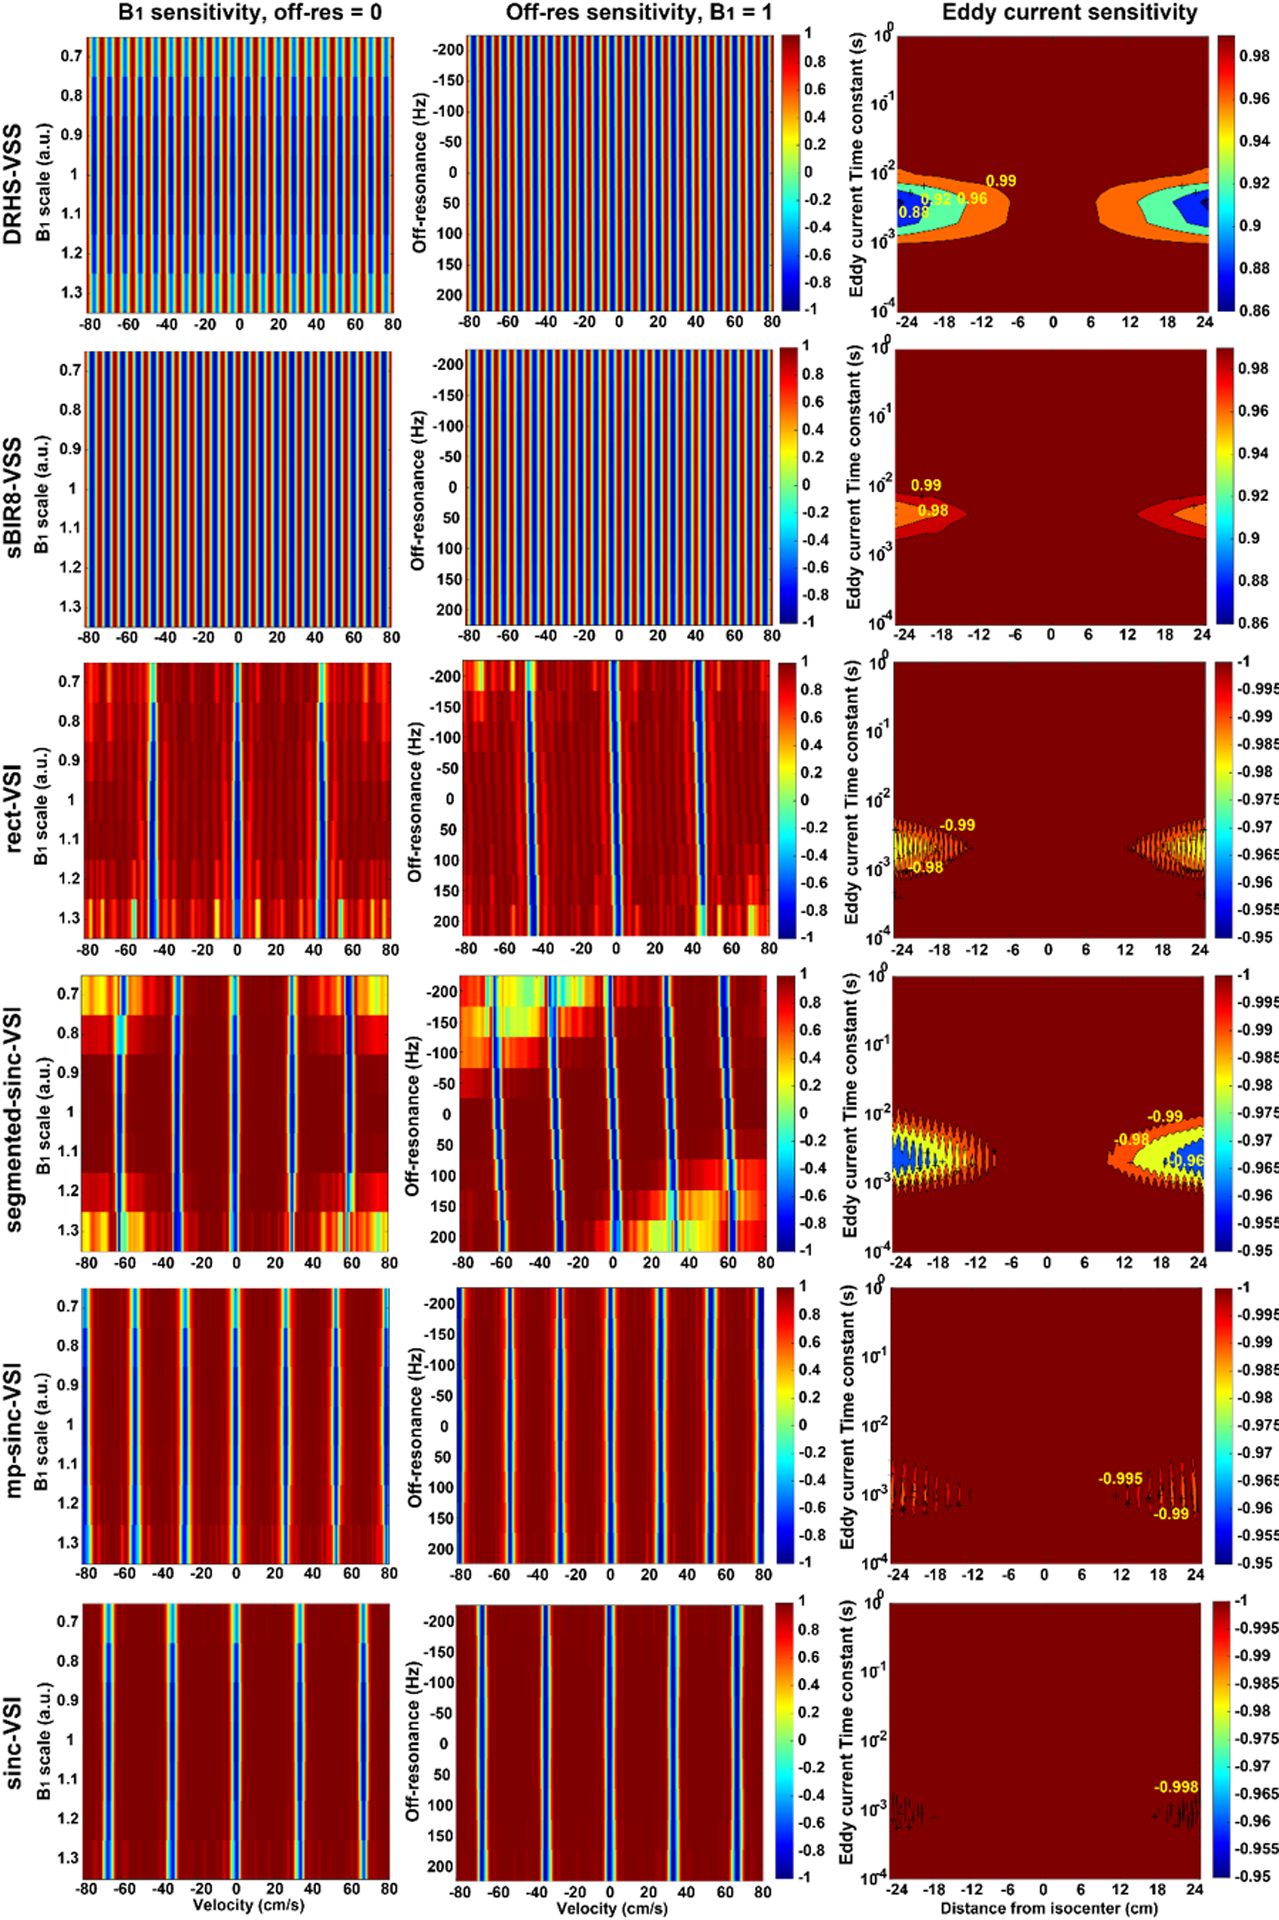
Figure 4:

The simulation results showing the performance of the VS labeling pulses: (A) the magnetization vs. mean velocity response under the labeling condition showing the sensitivity to B1 variation (ranging from 0.7 to 1.3 of the nominal value) without off-resonance; (B) the magnetization vs. mean velocity response under the labeling condition showing the sensitivity to B0 variation (ranging from −200 Hz to 200 Hz) when B1 = 1; (C) the magnetization of the static tissue (V = 0) under the label condition showing the eddy current (EC) sensitivity of the VSS and VSI pulses to EC components with different time constants (ranging from 0.1 ms to 1000 ms) at different distance to the iso-center of the magnet; where the magnetization under the control condition can be referred to the center line at distance = 0. Please note the different color scales for VSS and VSI pulses. The sBIR8-VSS pulse demonstrated strong immunity to B1 and B0 variation, and EC effects; while the sinc-VSI pulse had the highest robustness among the VSI pulses. Note that the response in panels A and B was generated before taking laminar flow effects into account.
