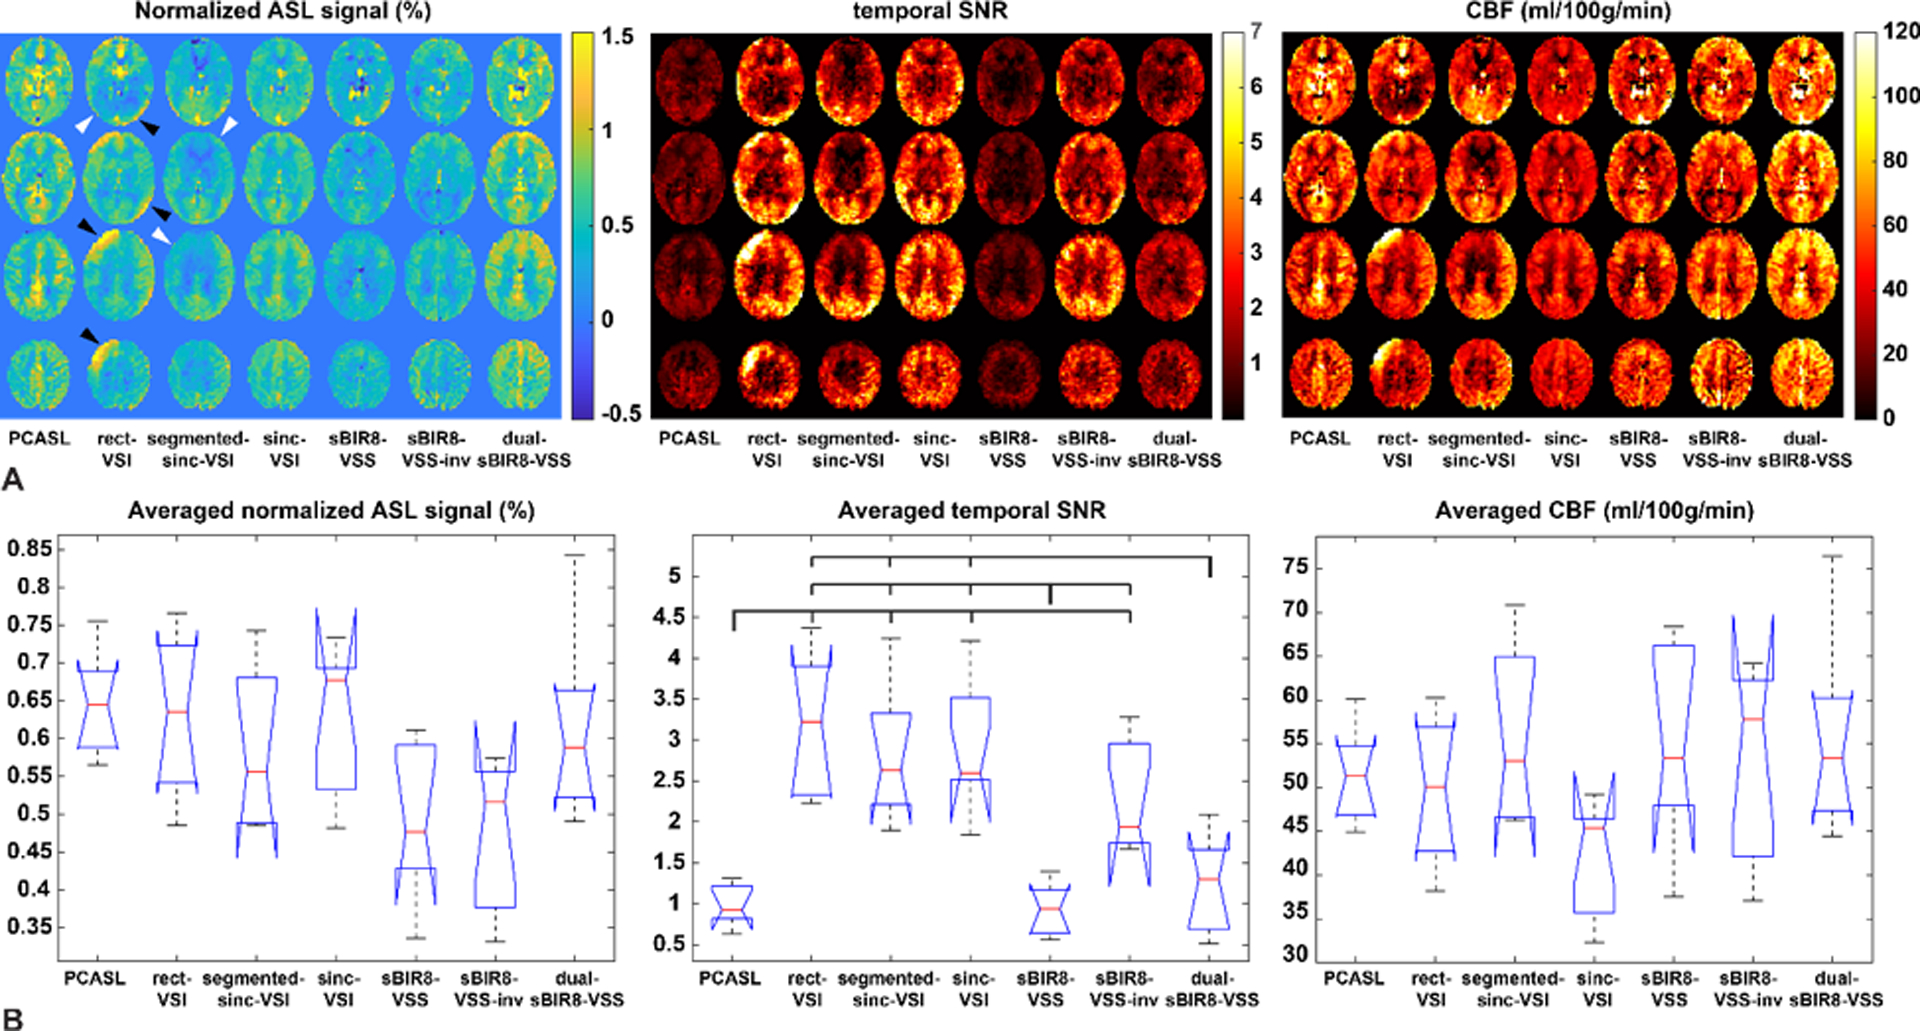
Figure 7:

(A) Comparison between labeling schemes on four slices from a representative subject, showing the relative signal change due to the label (left panel, normalized to the spin density image), the corresponding temporal SNR images for each of the techniques (middle panel) and the corresponding quantitative CBF maps (right panel); (B) the averaged ASL signal per voxel across subjects (left panel, normalized to the spin density image), the averaged temporal SNR per voxel across subjects (middle panel) and the averaged CBF values per voxel across subjects (right panel); where the red bars indicate the median values. The dual-sBIR8-VSS showed the greatest amount of signal. Note that the rect-VSI and the chopped VSI schemes contained artifacts with “spurious ASL signals” (black arrow heads) and “ASL signal void” (gray arrow heads), likely from eddy current effects, and/or inefficient labeling; while the images acquired with sBIR8-VSS or sinc-VSI pulses were free of such artifacts.
