Figure 1.

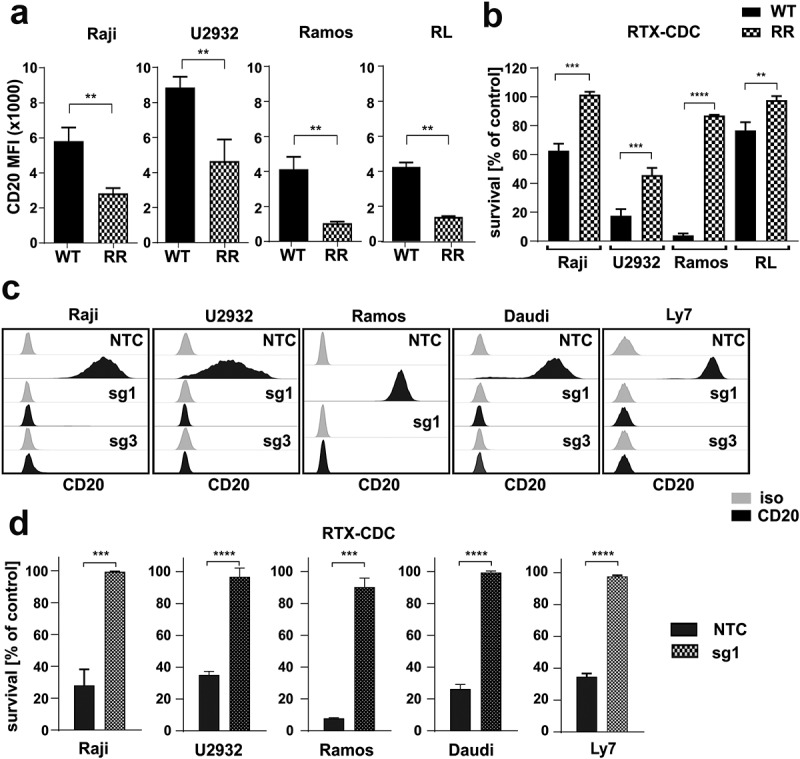
Decrease in CD20 is a hallmark of RTX-resistant cells.
(a) RTX-resistant (RR) cells were stained with FITC-conjugated anti-CD20 mAb. Dead cells were discriminated upon staining with PI. The results are presented as mean fluorescence intensity (MFI) of WT and RR cells (mean± SD). Statistical significance was determined with Welch’s t-test, **p<0.01 vs controls. (b) Equal amounts of WT and RR cells were incubated for 1 h (Raji, Ramos) or 4 h (U2932, RL) with 100 µg/mL (Raji, U2932, RL) or 10 µg/ml (Ramos) rituximab and 20% human AB serum as a source of complement. Cell viability was assessed with PI staining. The survival of cells is presented as a percentage of control cells without antibody (mean± SD). Statistical significance was determined using unpaired t-test, **p<0.01, ***p<0.001, ****p<0.0001 vs control WT cells. (c) Raji, U2932, Ramos, Daudi and Ly7 cells were stably transduced with sgRNA (sg1 or sg3) silencing CD20 or with non-targeting control RNA (sgNTC). The levels of CD20 were assessed with flow cytometry. Representative overlays of CD20 MFI are presented. (d) Equal amounts of NTC and CD20 KO cells (sg1) were incubated for 1 h (Raji, Ramos, Ly7, Daudi) or 4 h (U2932) with 100 µg/mL (Raji, U2932, Ly7, Daudi) or 10 µg/ml (Ramos) rituximab and 20% human AB serum as a source of complement. Cell viability was assessed with PI staining. The survival of cells is presented as a percentage of control cells without antibody (mean± SD). Statistical analysis was performed using unpaired t-test, ***p<0.001, ****p<0.0001 vs controls. The experiments were repeated independently four times.
