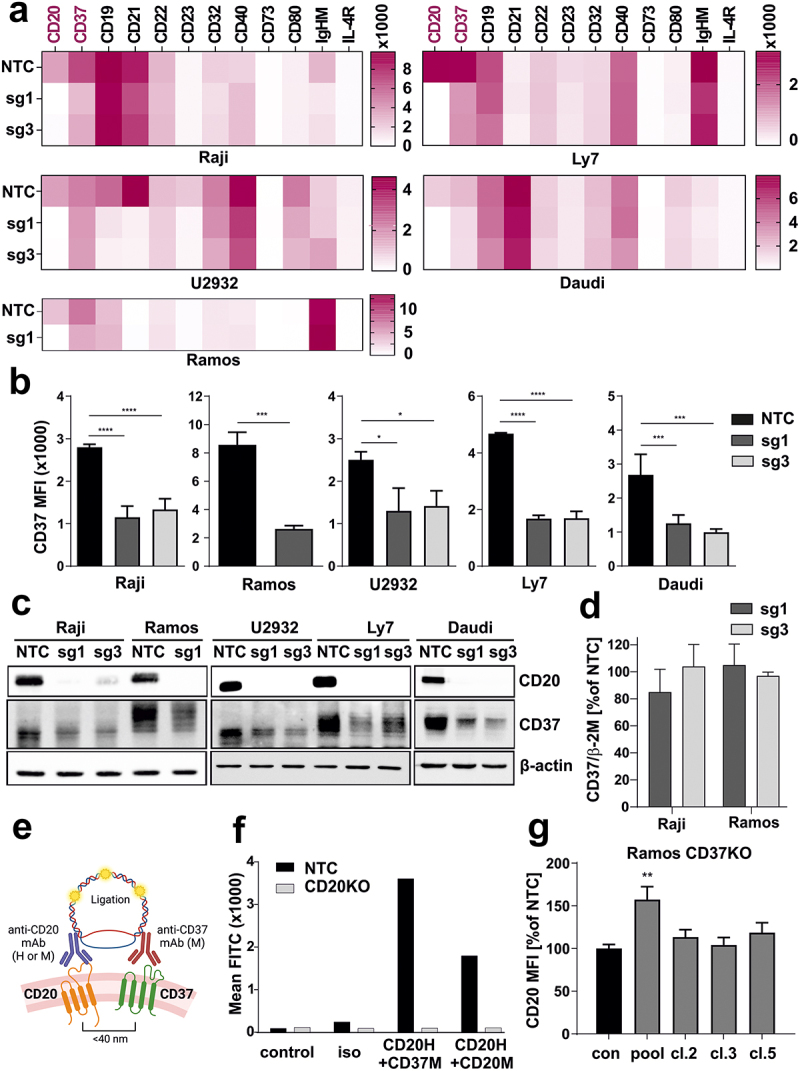
Figure 2.

CD20 KO cells are characterized with diminished CD37 levels.
(a) NTC and CD20 KO cells were stained with specific fluorochrome-conjugated antibodies targeting surface proteins typical for B-cells. The results are presented as heatmaps. (b) NTC and CD20 KO cells were stained with FITC-conjugated anti-CD37 mAb. Dead cells were discriminated upon staining with PI. The results are presented as MFI of NTC and CD20 KO cells (mean ± SD). Statistical significance was determined using 1-way ANOVA (NTC vs. sg1 or sg3) or with Welch’s t-test (NTC vs sg1) *p<0.05, ***p<0.001, ****p<0.0001 vs controls. (c) The levels of CD20 and CD37 were assessed with Western blotting in whole-cell lysates from NTC and CD20 KO cells. β-actin was used as a loading control. (d) cDNA from Raji and Ramos NTC and CD20 KO – sg1 and sg3 cells were used for qRT-PCR amplification of CD37 and β-2 M. Relative reverse transcription quantitative polymerase chain reaction expression of CD37 gene was calculated by the user non-influent second derivative method and shown as log-transformed target to reference ratio. β-2 M gene served as a reference. (e) Proximity ligation experiment design. Cells of interest were incubated with saturating amounts of unlabeled human anti-CD20 mAb and mouse anti-CD37 mAb. Following incubation with anti-human and anti-mouse probes, in situ ligation and amplification, the formed protein complexes were analyzed in flow cytometry. (f) PLA assay was performed in Raji NTC and sg1 cell lines to prove the formation of complex between CD20-CD37. The results are presented as MFI from a representative experiment. The experiments were repeated independently three times. (g) Ramos WT cells were edited with CD37-targeting sgRNA, CD37-negative cells were sorted on a FACS sorter, and single-cell clones were generated. Non-targeting sgRNA (NTC) was used as a negative control. CD20 expression was assessed by flow cytometry. The results are presented as a percentage of MFI of control NTC cells (mean ± SD). Statistical analysis was performed using 1-way ANOVA, **p<0.01.
