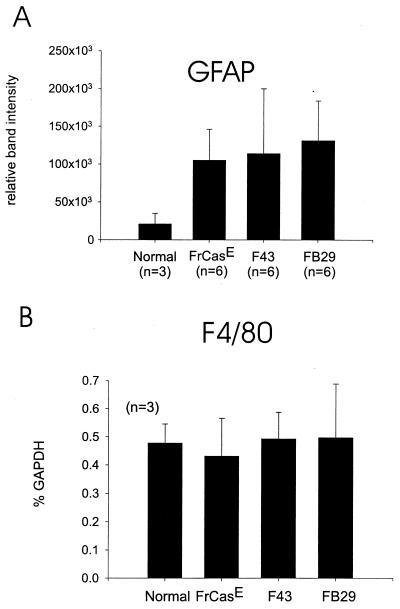
FIG. 3.
Quantification of markers of glial activation in mice 16 days after inoculation of FrCasE, F43, or FB29, a time point at which all FrCasE-inoculated mice exhibited severe neurologic disease. Upregulation of GFAP (A) is a marker of astrocytic activation (12) and was measured by semiquantitative Western blotting. Bands developed by chemiluminscence were quantified after digitization with ImageQuant (Molecular Dynamics) software and are expressed in terms of volume as a measure of relative signal strength. There was a significant difference (P = 0.01) between the infected mice (grouped together) and the uninoculated controls, but no significant differences between the infected groups were found. Upregulation of F4/80 (B) is a marker of microglial activation (2) and was measured at the mRNA level by an RNase protection assay. Data is expressed as percentage of the signal from the “housekeeping” gene encoding GAPDH. There was no evidence for upregulation of F4/80 in any of the infected mice.

