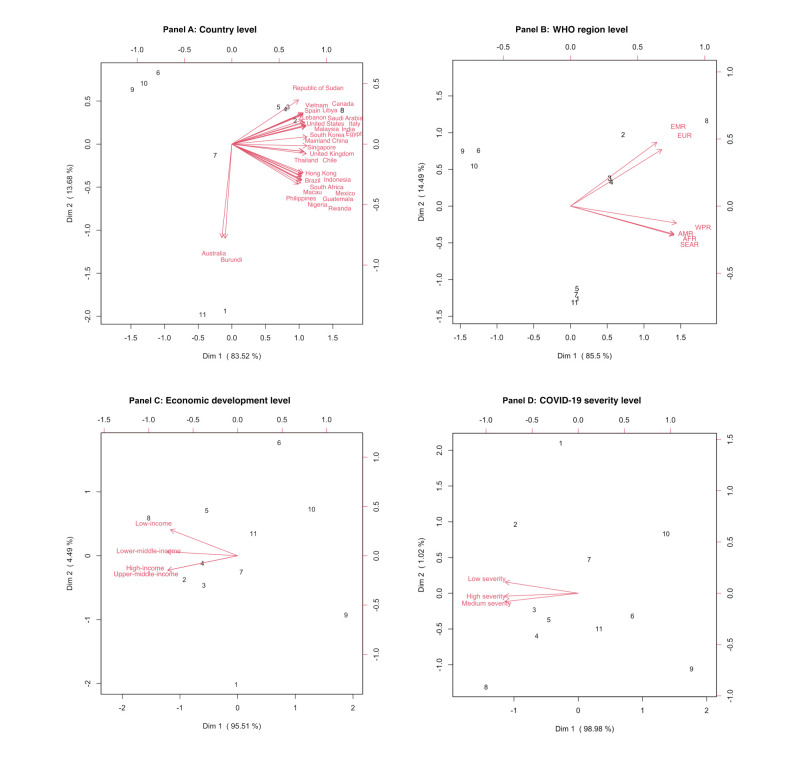
Figure 3.
Biplots of multidimensional preference analysis, displayed as vectors for fear of factors and shown as numbers. Panel A. By country. Panel B. By WHO region. Panel C. By economic development level. Panel D. By COVID-19 severity level. The numbers in each panel refer to those listed in Table 2, while an arrow corresponds to a country or region and points toward increased level of fear. For each area, the projected length on the arrow corresponding to a particular country or region reflects the magnitude of the fear on that factor relative to other factors in the country. AFR – African Region, AMR – Region of Americas, EMR – Eastern Mediterranean Region, EUR – European Region, SEAR – South-East Asian Region, WPR – Western Pacific Region..

