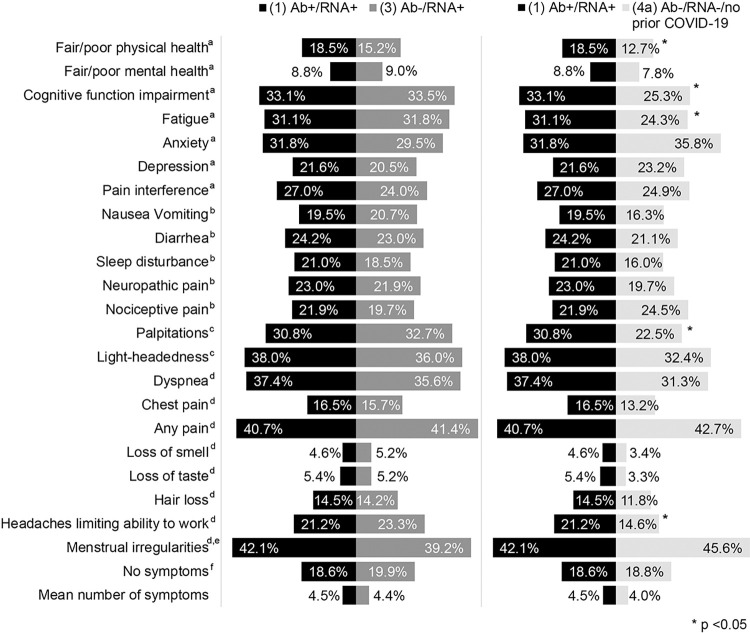
Fig 2. Weighted percentage of participants reporting symptoms by group.
aPROMIS T-score (using PROMIS cut-offs): Physical health, mental health: Fair/poor versus good/very good/excellent; cognitive function, fatigue, anxiety, depression, pain interference: Mild/moderate/severe versus normal. bPROMIS T-score (using cut-offs from data): Nausea/vomiting, diarrhea, sleep disturbance, neuropathic pain, nociceptive pain: 75th percentile. cMore than 1 question asked, analyzed as present if participants answered yes to any of the questions in that domain. dSingle question asked for the domain and analyzed. eReported in menstruating women. fReported no symptoms.

