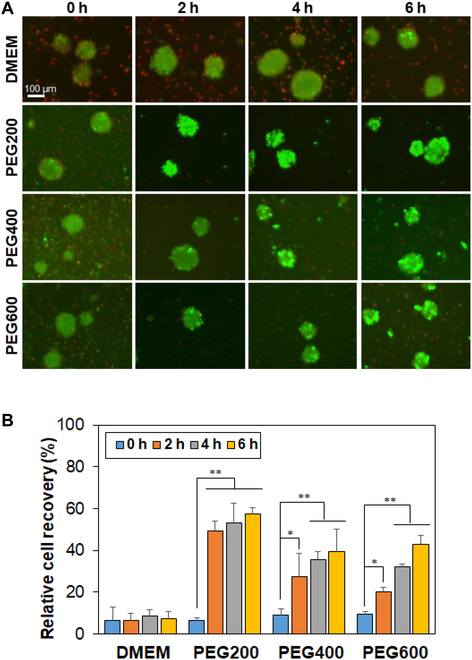
Fig. 2.

(A) Live/dead images of SCSs recovered from cryopreservation at –196 °C for 7 days. Live and dead cells are shown in green and red, respectively. 0 h, 2 h, 4 h, and 6 h indicate the preincubation time of SCSs in the presence of PEGs (10 wt.% in DMEM) at 37 °C before cryopreservation. The scale bar is 100 μm. (B) Quantitative analysis of spheroid recovery using the CCK-8 kit. Recovery rate of SCSs from cryopreservation in DMSO 10% was assigned as 100%. N = 3. The asterisks * and ** indicate P < 0.05 and P < 0.01, respectively.
