
Figure 5.
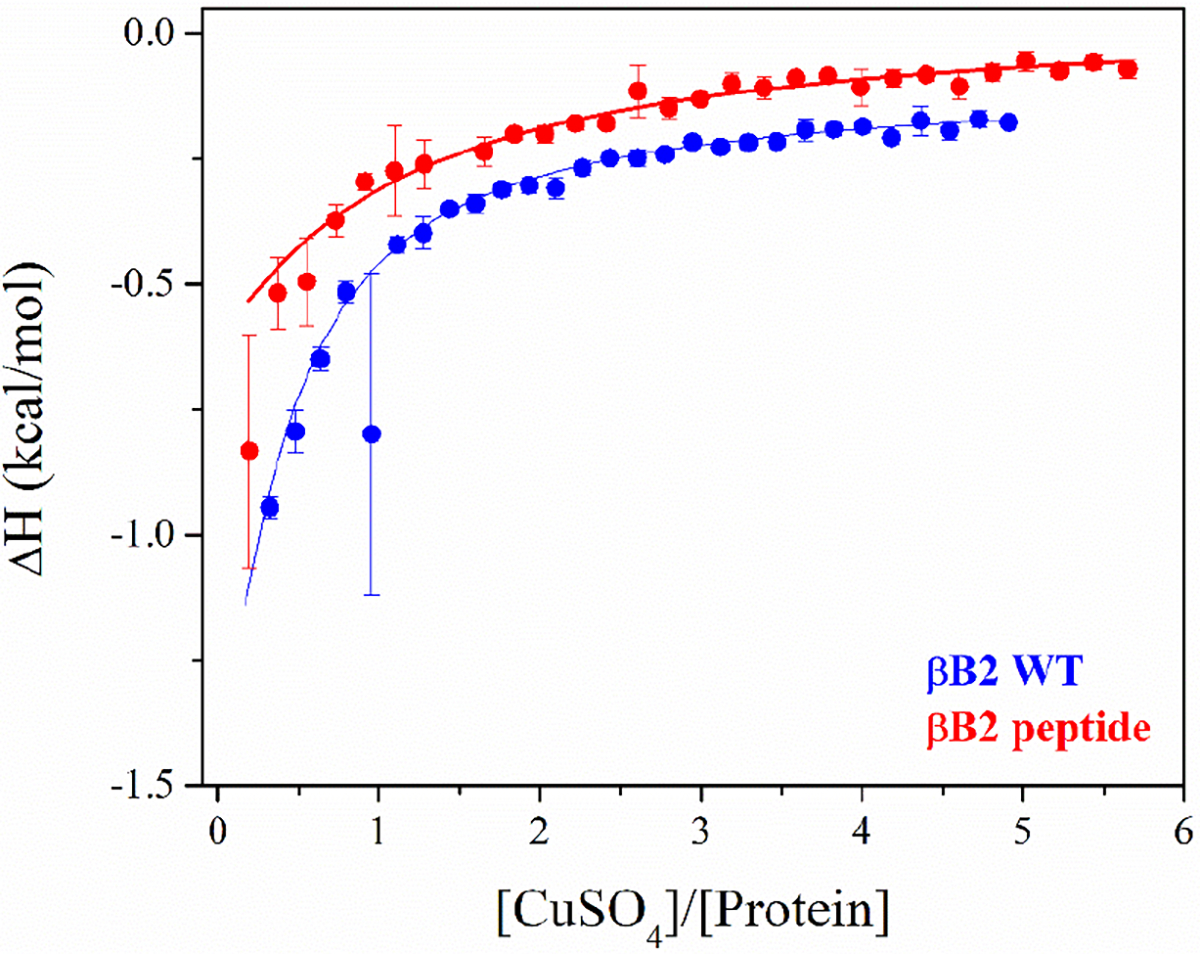
ITC experiments of βB2 WT (blue) and βB2 peptide (red) with copper at 25 °C. Data were obtained from 30 titrations of 10 μL of CuSO4 (500–750μM) into a fresh protein solution (23 μM for βB2 WT and 30 μM for βB2 peptide) in 10mM MOPS buffer, pH 7.0. Raw ITC data are shown in Figure S6. ITC data were fitted using the software AFFINImeter,48 and the best model was selected based on the lowest value of χ2.