FIGURE 1.

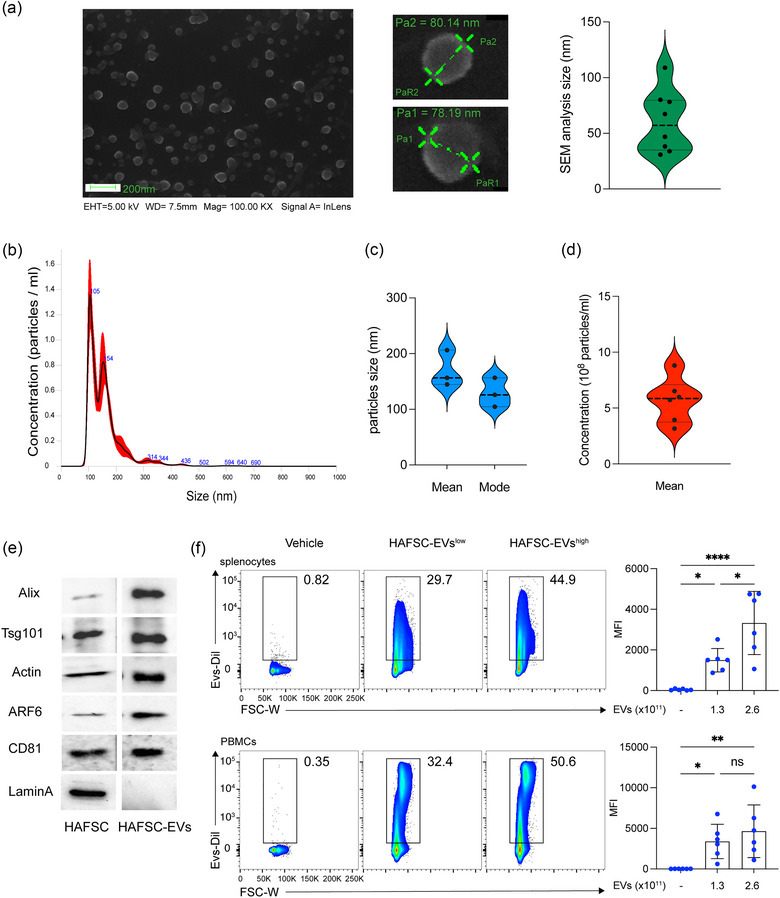
Characterization of EVs derived from human amniotic fluid stem cells (HAFSC‐EVs). (a) HAFSC‐EVs morphology and diameter measure by SEM. Magnification bar corresponds to 200 nm; Violin box graph displaying mean sizes of HAFSC‐EVs. (b) HAFSC‐EVs size distribution and concentration determinated by nanoparticle tracking analysis. Representative spectra are shown. Blue values correspond to the size of the main peaks in the histogram. (c) Mean and mode of particles size (nm) and (d) mean concentration of HAFSC‐EVs (number/mL) are reported in the graphs. (e) Molecular characterization of isolated HAFSC‐EVs by Western blot of specific EV markers compared to parent stem cells. Western blot analysis revealed the presence of CD81, ARF6, Actin, Tsg101, Alix and absence of Lamin‐A that is expressed only by cells. (f) Representation plot of EVs binding on murine splenocytes and human PBMCs after 6 h exposition of cells with EVs (HAFSC‐EVslow and HAFSC‐EVshigh correspond to 1.3 × 10⁹ and 2.6 × 10⁹ particles/1 × 106 cells). Data are represented as mean ± SD of MFI (mean fluorescent intensity). *p < 0.05; **p < 0.01 by one‐way ANOVA with Tukey's multiple comparison test.
