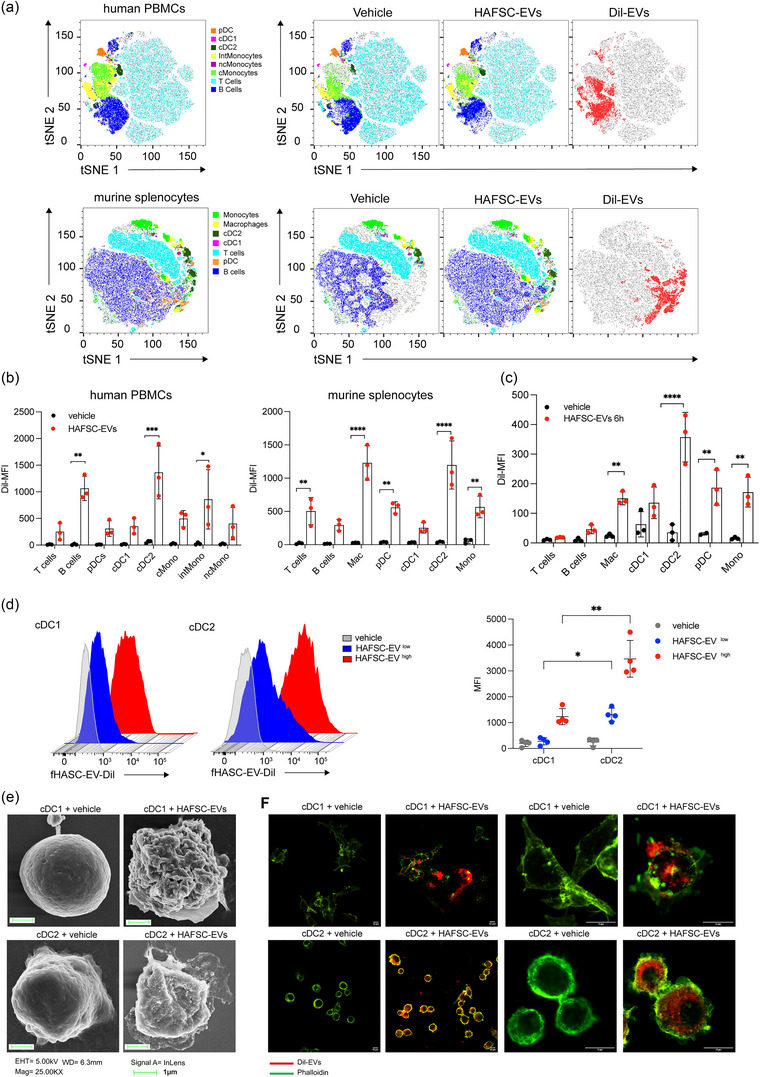
FIGURE 2.

HAFSC‐EVs uptake in immune cells. (a) Total hPBMC and murine splenocytes were treated in vitro with Dil‐HAFSC‐EV 1.3 × 10⁹ (HAFSC‐EVlow) for 6 h, washed with PBS, stained with the fluorophore‐conjugated antibodies and analysed by flow cytometry. Two‐dimensional t‐SNE analysis (FlowJo) represents the various cell populations before and after treatment with HAFSC‐EVs and the distribution of EVs (red) on total human PBMCs and murine splenocytes (grey). Data shown are representative of three independent experiments. (b) Dil signal was registered in different immune cell populations by using antibodies directed against specific immune cell markers and analysed by Flow Jo. The most significant EVs uptake was detected in cDC2 cells both in human and murine samples. Data are represented as mean ± SD of MFI (mean fluorescent intensity) of three experiments (**p < 0.01, ***p < 0.001, ****p < 0.0001 two‐way ANOVA with Bonferroni's multiple comparison test). (c) Dil‐HAFSC‐EV or vehicle were injected intravenously into mice, and spleens were harvested after 24 h (see also in Figure S2). Dil signal was evaluated ex‐vivo by flow cytometry in different immune cell populations. Data are represented as mean ± SD of MFI (mean fluorescent intensity) of three independent experiments (****p < 0.0001 two‐way ANOVA with Bonferroni's multiple comparison test). (d) Vesicles uptake was measured in bone marrow derived DCs (cDC1 and cDC2) after 6 h incubation with 1.3 × 10⁹ (HAFSC‐EVslow) and 2.6 × 10⁹ (HAFSC‐EVshigh) Dil‐HAFSC‐EVs /1 × 106 cells. Indicated is the mean ± SD of MFI of cDC1 and cDC2, detected by anti‐CD24 and anti‐CD172, respectively, positive for Dil‐HAFSC‐EVs (showed histograms is one experiment representative of three) (*p < 0.05 **p < 0.001 two‐way ANOVA with Tukey recommended multiple comparison test). (e) Vesicles uptake by cDC1 and cDC2 derived from bone marrow analysed by SEM (scanning electron microscopy) after 6 h EVs treatment. Representative images of three different experiments. Magnification bar corresponds to 1 μm. (f) Confocal immunofluorescence images of cDC1 and cDC2 cells treated with Dil‐labelled‐HAFSC‐EVs for 6 hours, controls were treated with vehicle. Pictures show representative confocal fluorescence images of three independent experiments. Magnification bar corresponds to 10 μm.
