FIGURE 4.

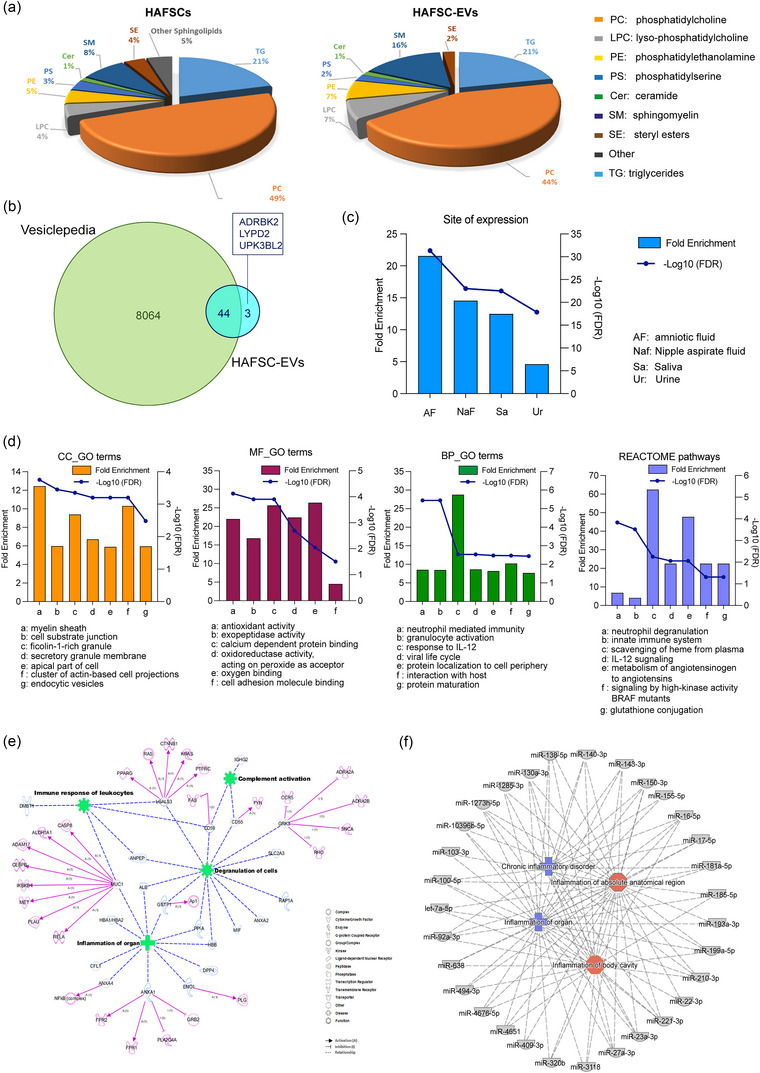
Analysis of HAFSC‐EVs composition. (a) Comparison of lipids composition of HAFSCs and HAFSC‐EVs membrane. Relative abundances for each lipid classes in cells and EVs: TG Triacylglycerols, PC Glycerophosphocholines, LPC Monoacylglycerophosphocholines, PE Glycerophosphoethanolamines, PS Glycerophosphoserines, Cer Ceramides, SM Sphingomyelins, SE Sterol Lipids, Other Sphingolipids. (b) The Venn diagram of proteins identified in HAFSC‐EVs and EVs isolated from biofluids (amniotic fluid, aqueous humour, plasma, serum, saliva, urine) and placenta. (c) Enrichment analysis of site of expression of proteins identified in the HAFSC‐EVs performed by Funrich. (d) Gene Ontology terms and Reactome Pathways enrichment analyses performed by WebGestalt. Among the 10 most enriched functional terms listed in the Table S1 sheet “Enriched CC_GO TERMS”, the first seven are reported in the histograms. Within the MF_GO terms, only six terms were found significantly enriched. CC: Cell Component; BP: Biological Process; MF: Molecular Function. (e) Network generated in Ingenuity Pathway Analysis (IPA) for proteins identified in HAFSC‐EVs. The meaning of the shapes (nodes) and type of interactions (edges) are defined in the graphical legends. Blu nodes are proteins found in HAFSC‐EVs; green nodes indicate functional activities in which HAFSC‐EVs proteins are involved; pink nodes are predicted direct targets of HAFSC‐EVs proteins. (f) Mixed phenotype‐miRNAs network generated by Ingenuity Pathway Analysis (IPA) for miRNAs identified in HAFSC‐EVs. 31 miRNAs were associated to inflammation; blue nodes are associated with chronic inflammatory disorders while red nodes are implicated in inflammation of absolute anatomical region or body cavity.
