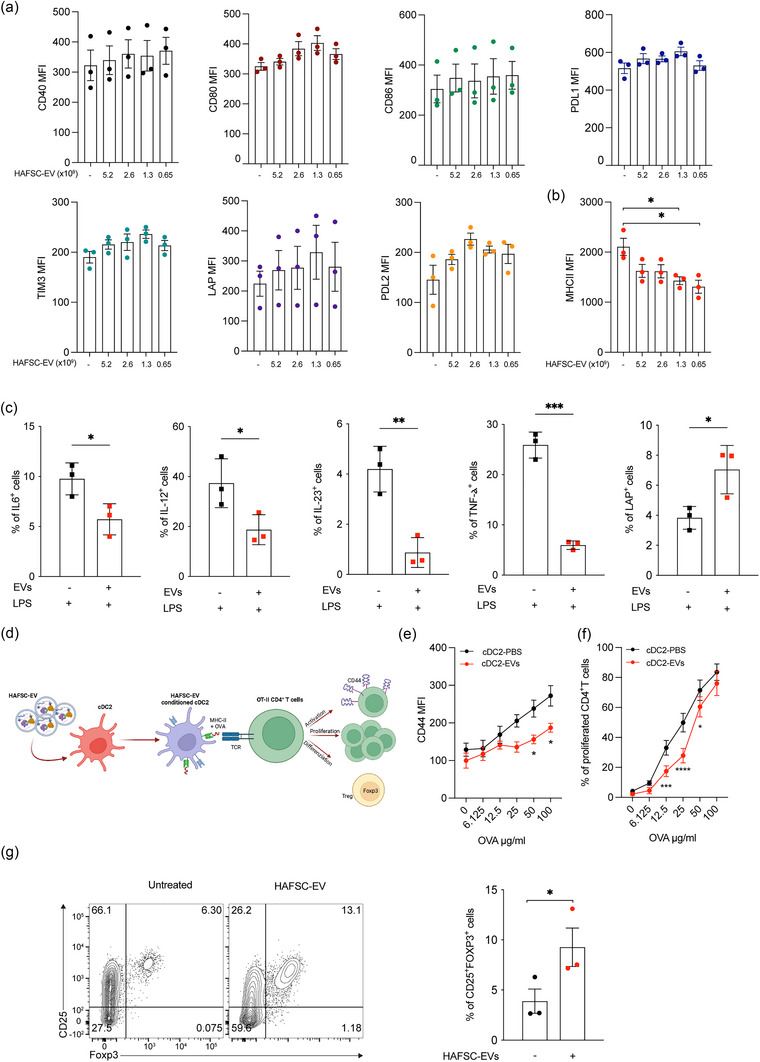
FIGURE 5.

cDC2 conditioning by HAFSC‐EVs treatment. (a, b) Analysis of cDC2 activation markers was performed by FACS by overnight incubation with various amounts of HAFSC‐EVs as shown. Data are shown as mean ± SD of MFI (n = 3, *p < 0.05; by one‐way ANOVA with Tukey recommended multiple comparison test). (c) Analysis of cytokines produced by bone marrow derived cDC2 pre‐treated overnight with HAFSC‐EVs and subsequently treated with LPS (1 ug/mL) for 6 h in the presence of PMA/Ionomycin and Brefeldin‐A. Percentage of cells positive for IL‐6, IL‐12, IL‐23, TNF‐α, and LAP are shown as mean ± SD (n = 3, *p < 0.05; ***p < 0.001 by unpaired t‐test, two‐tailed). (d) Schematic representation of co‐culture characteristics between EVs‐conditionated‐cDC2 and mouse CD4+ T cells. (e) OT.II CD4+ T cells were co‐cultured with cDC2 pretreated with HAFSC‐EVslow overnight as indicated in D, in the presence of different concentrations of soluble OVA protein. Data are shown as MFI (n = 3, *p < 0.05; by two‐way ANOVA with Bonferroni's multiple comparison test). (f) cDC2, treated as in D, were assayed for presentation to CFSE‐labelled OT‐II T cells in the presence of different concentrations of soluble OVA protein. Data are shown as percentage of CFSE−CD4+CD44+ TCRVα2+ as mean ± SD (n = 3, *p < 0.05; ***p < 0.001, ****p < 0.0001, two‐way ANOVA with Bonferroni's multiple comparison test). (g) CD4+ T cells were purified from the spleen of wild type mice and co‐cultured with cDC2 pre‐treated with HAFSC‐EVslow. Three days after Foxp3 expression was evaluated by flow cytometry. Data are shown as mean ± SD of percentage of CD25+Foxp3+ cells (n = 3, *p < 0.05; by unpaired t‐test, two‐tailed). Dots represent each individual mouse.
