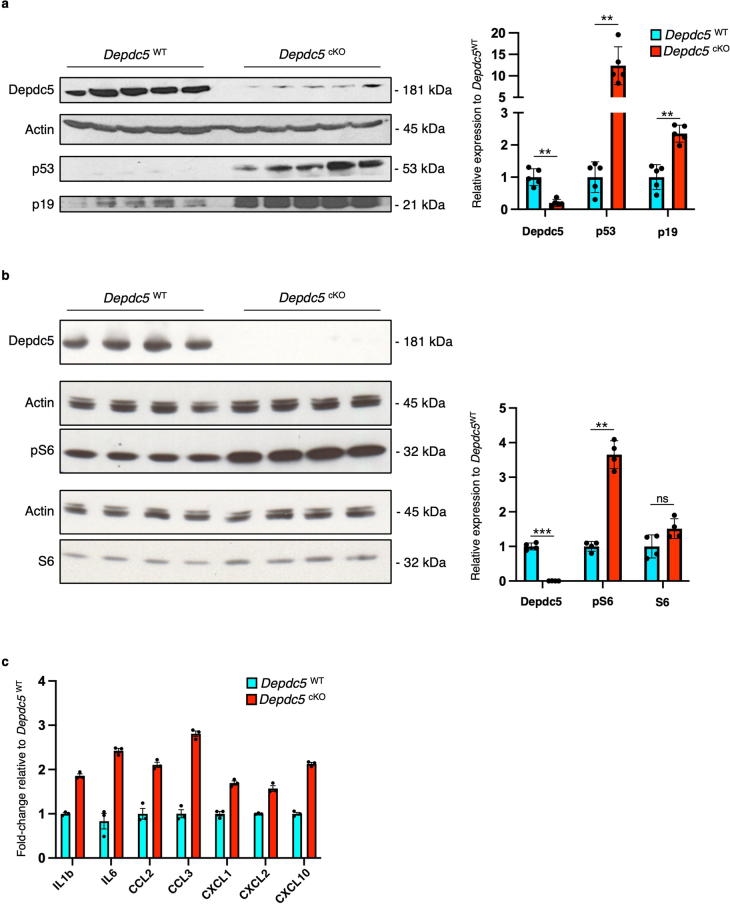
Extended Data Fig. 7. Cellular senescence in a mouse model of Depdc5-deficiency.
(a) Western blotting against Depdc5, p53 and p19 on n = 5 Depdc5WT and n = 5 Depdc5cKO 10-weeks old mice (corresponding to 5 biological replicates). Histogram showing the relative expression of Depdc5, p53 and p19 to Actin, normalized to Depdc5WT. **P = 0.0079; Two-tailed Mann-Whitney test. (b) Western blotting against Depdc5, pS6 and total S6 on n = 4 Depdc5WT and n = 4 Depdc5cKO 10-weeks old mice (corresponding to 4 biological replicates). Histogram showing the relative expression of Depdc5, pS6 and total S6 to Actin, normalized to Depdc5WT. **P = 0.0286; Two-tailed Mann-Whitney test. (c) Histograms showing the quantification of canonical SASP interleukins and cytokines production in n = 3 Depdc5WT and n = 3 Depdc5cKO brain lysates at 10-weeks of age (averaging 2 technical replicates per animal). Values are normalized to the mean of Depdc5WT. Dots indicate all replicates. Scatter dot plots are presented as mean ± SEM.

