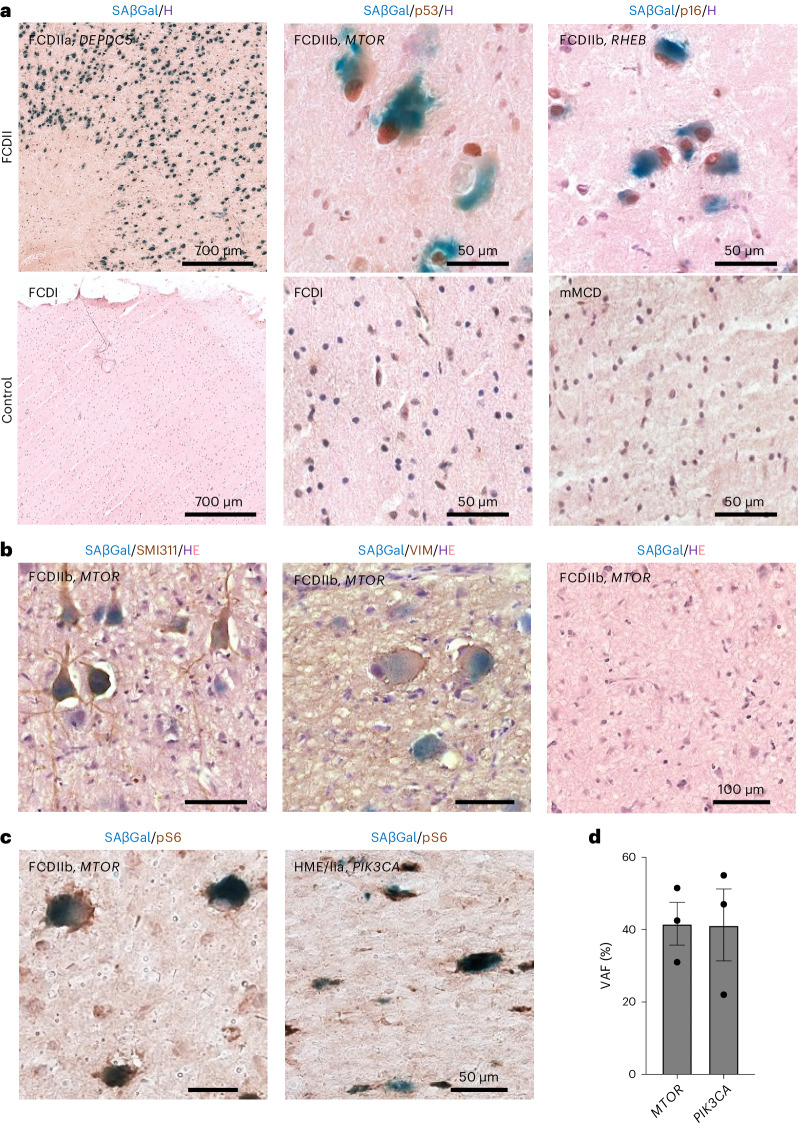
Fig. 2. Cellular senescence hallmarks in FCDII surgical tissues.
a, Representative SAβGal colorimetric assay (blue), p53 (brown) or p16 (brown) immunohistochemistry and hematoxylin (H; purple) counterstaining on FCDII samples (left to right: patient ID 10 (wider field of view), patient ID 3 and patient ID 14 and epilepsy control samples (left to right: patient ID 15 (wider field of view), patient ID 15 and patient ID 16)). b, SAβGal colorimetric assay (blue), SMI311 (brown) or VIM (brown) immunohistochemistry and hematoxylin and eosin (H, purple; E, pink) counterstaining on a FCDIIb sample (patient ID 8, slice 3) used for MEA recordings in a region with SMI311+ DNs (left), VIM+ BCs (middle) or without pathogenic cells (right). c, SAβGal colorimetric assay (blue) and pS6 (brown) immunohistochemistry on (left) MTOR-related FCDIIb (patient ID 3) and (right) PIK3CA-related HME/IIa (patient ID 13). d, VAF in n = 3 pools of n = 70–80 microdissected SAβGal+/pS6+ cytomegalic cells per pool from one MTOR-related FCDIIb (patient 3) and one PIK3CA-related HME/IIa (patient ID 13). Each dot indicates a biological replicate. Scatter dot plots are presented as mean ± s.e.m.

