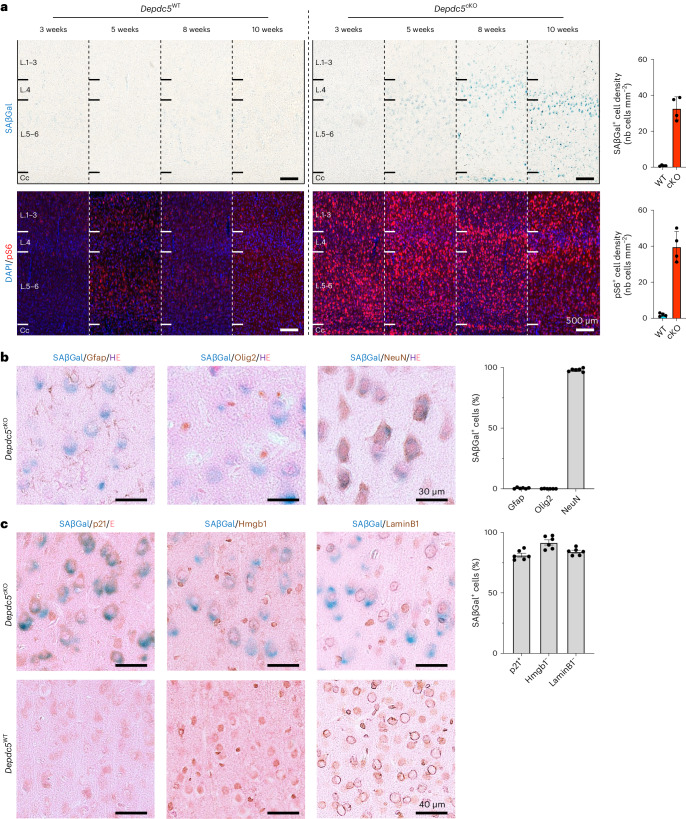
Fig. 3. Cellular senescence hallmarks in a mouse model of Depdc5 deficiency.
a, SAβGal colorimetric assay (top, blue) and pS6 immunostaining (bottom, red) on Depdc5WT and Depdc5cKO animals from 3 weeks to 10 weeks of age and quantification of the density of SAβGal+ and pS6+ cells per mm2 in 10-week-old Depdc5WT (n = 4) and Depdc5cKO (n = 4) mice. Cc, corpus callosum; L.1–3, cortical layers 1 to 3; L.4, cortical layer 4; L.5–6, cortical layers 5 and 6. b, SAβGal colorimetric assay (blue) and immunohistochemistry against neural cellular markers (DAB) on Depdc5cKO animals at 10 weeks of age. Quantification of the percentage of SAβGal+ cells positive for Gfap, Olig2 or NeuN in n = 6 samples of 10-week-old Depdc5cKO mice (two slices from rostral and caudal regions per n = 3 animals). c, SAβGal colorimetric assay (blue) and immunohistochemistry against cellular senescence markers (DAB) on Depdc5WT and Depdc5cKO animals at 10 weeks of age. Quantification of the percentage of SAβGal+ cells positive for p21 and negative for nuclear Hmgb1 and LaminB1 in n = 6 samples of 10-week-old Depdc5cKO mice (two slices from rostral and caudal regions per n = 3 animals). Scatter dot plots are presented as mean ± s.e.m. nb, number of.

