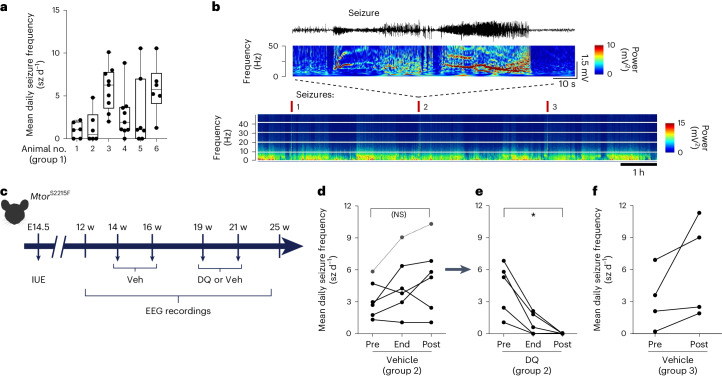
Fig. 5. Beneficial effect of DQ administration on epileptic seizures in MtorS2215F animals.
a, Mean daily seizure frequency in n = 6 individual MtorS2215F animals over 6–9 recording sessions on three consecutive days (410–641 h). Data are presented as box plots and have the following values (minimum, 25th percentile, median, 75th percentile, maximum, mean, s.d. and s.e.m.): 1 (0, 0, 1, 2, 2.2, 1, 0.92 and 0.38); 2 (0, 0, 0.48, 2.8, 4.8, 1.3, 1.9 and 0.78), 3 (2, 3.5, 6.3, 7.8, 10, 5.9 and 2.6); 4 (0, 1, 1.9, 3.7, 8.8, 2.7, 2.6 and 0.88); 5 (0, 0, 1, 7, 11, 3, 4.1 and 1.6); and 6 (1.3, 4.1, 5.7, 7.7, 11 and 5.8, 3). b, Top, representative EEG trace and corresponding FFT power spectrum over 1 min of recording. Bottom, representative color-coded FFT power spectrum over 7 h of recording showing seizures annotated with red ticks and reflected by sharp increases in frequency and amplitude. The data shown were extracted from one cortical electrode located in the somatosensory S1 cortical area of one non-treated MtorS2215F animal. c, Study design for longitudinal in vivo experiments and timepoints of analyses. d, Mean daily seizure frequency in n = 6 individual MtorS2215F animals over 2 weeks before vehicle administration (‘Pre’), over 48 h after the end of vehicle administration (‘End’) and over 3 weeks after vehicle administration (‘Post’). Statistics: two-tailed Mann–Whitney test. Not significant (NS): P = 0.4375. e, Mean daily seizure frequency in the same n = 5 individual MtorS2215F animals over 3 weeks before DQ administration (‘Pre’), over 48 h after the end of DQ administration (‘End’) and over 4 weeks after DQ administration (‘Post’). One animal (dashed lines) died from seizures during the interphase between vehicle and DQ administration. Statistics: two-tailed Mann–Whitney test. *P = 0.0312. f, Mean daily seizure frequency in n = 4 MtorS2215F animals over 2 weeks before (‘Pre’) and 2 weeks after (‘Post’) vehicle administration. Each dot corresponds to one animal. Veh, vehicle; w, weeks.

