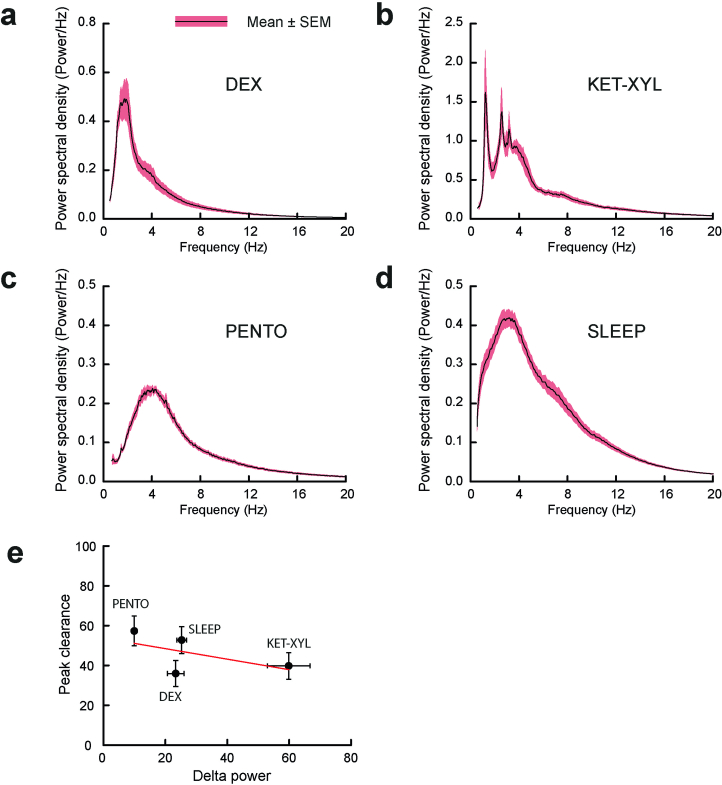
Extended Data Fig. 8. Power spectra during anesthesia and correlation with peak clearance.
Power spectral density plots during anesthesia were calculated for the three anesthetics a-c and d, during recovery sleep. For the anesthetics, the power spectra were carried out using the EEG recorded during the first 2 hours of anesthesia (excluding the first ten minutes following injection). For sleep, the power spectra were calculated during 2 hours of recovery sleep, which included some time in WAKE (9.3%) and REM (9.9%) states. e, There was a weak negative correlation (Pearson’s correlation coefficient −0.58) between delta (0.5–4.0 Hz) power and peak clearance (see Fig. 2d–g and Extended Data Table 1). PENTO (n = 10 mice), DEX (n = 9 mice), SLEEP (n = 9 mice) and KET/XYL (n = 9 mice). The errors bars represent SEMs and where they are not shown they were smaller than the size of the symbol.

