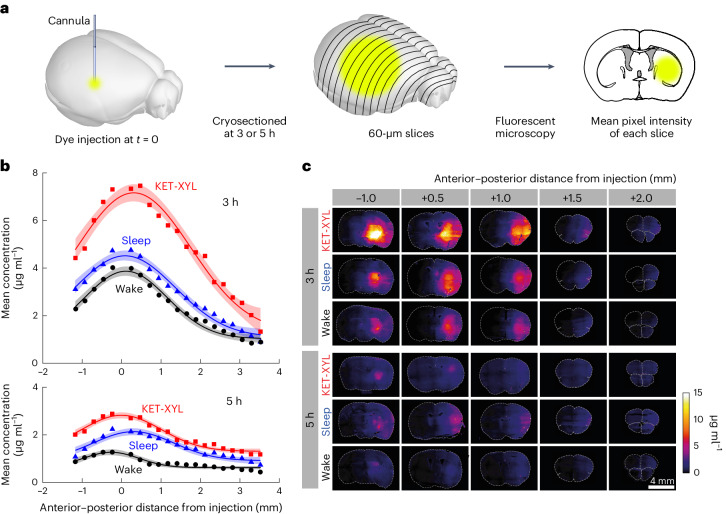
Fig. 3. Histology data confirm that brain clearance is reduced by sleep and anesthesia.
a, At either 3 or 5 h following injection of AF488 into the CPu, the brain was frozen and cryosectioned at 60 μm. The average fluorescent intensity across each slice was obtained by fluorescent microscopy; then the mean intensities across groups of four slices were averaged. b, The mean fluorescence intensity was converted to a concentration using the calibration data in Supplementary Fig. 1 plotted against the anterior–posterior distance from the point of injection for wake (black), sleep (blue) and KET-XYL (red) anesthesia. Top, the data after 3 h. Bottom, the data after 5 h. The lines are Gaussian fits to the data and the error envelopes show the 95% confidence intervals. At both 3 and 5 h, the concentrations during KET-XYL (P < 10−6 at 3 h; P < 10−6 at 5 h) and sleep (P = 0.0016 at 3 h; P < 10−4 at 5 h) were significantly larger than wake (two-way ANOVA with Bonferroni–Holm multiple comparisons correction). c, Representative images of the brain slices across the brain (anterior–posterior distance from the site of AF488 injection) at both 3 h (top three rows) and 5 h (bottom three rows). Each row represents data for the three vigilance states (wake, sleep and KET-XYL anesthesia). The color scale on the right shows the concentrations, determined using the calibration data in Supplementary Fig. 1.

