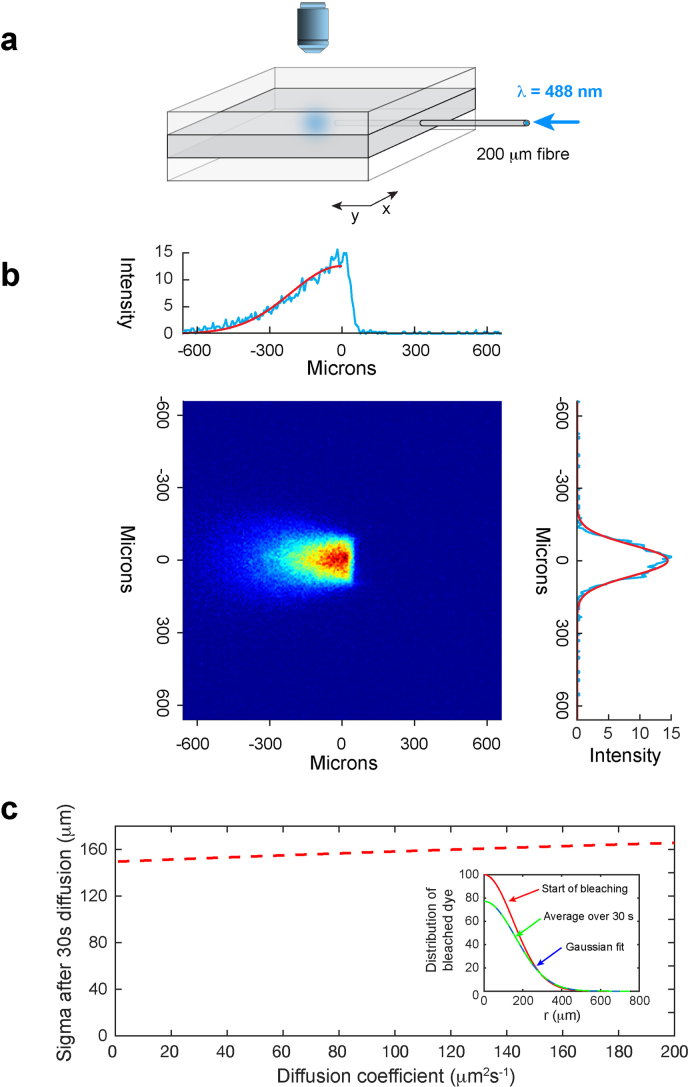
Extended Data Fig. 1. Measurement of the distribution of bleached dye.
a, A thin brain slice or sheet of an agarose gel brain phantom containing FITC-dextran was sandwiched between two blocks of clear agarose (Methods). An optical fiber (core diameter 200 μm) was inserted into the brain slice or central gel and an image taken of the light distribution of a 488 nm-laser diode. b, The intensity distribution from a digitized image (blue lines) was then fit to a hemispherical Gaussian distribution (red solid lines). The average value for the standard deviations of the Gaussian fits was σ = 149.5 μm (CI [140.7, 162.6]; n = 8 independent experiments). c, There is a small change in this standard deviation due to diffusion during the 30 s of bleaching (red dashed line), which differs for each molecular weight due to the different diffusion coefficients. This was estimated by averaging the dye distribution (equation [2]) over 30 s and then fitting this to a Gaussian. Inset: An example of how the dye distribution changes during bleaching for 4 kDa FITC-dextran, D = 133.9 μm2 s−1. The red curve is the Gaussian distribution at the start of bleaching (σ = 149.5 μm), the green curve is the average distribution over 30 s, fitted to a Gaussian (blue dashed line) which gives (σ = 161.0 μm).). The values of σ that were used for the diffusion measurements in agarose gel for 4 kDa, 10 kDa and 70 kDa FITC-dextran were 152.1 μm, (CI [143.3, 165.0]; n = 8 independent experiments), 156.2 μm, (CI [147.7, 169.0]; n = 8 independent experiments) and 161.0 μm, (CI [152.6, 173.2]; n = 8 independent experiments), respectively.

