Figure 6.
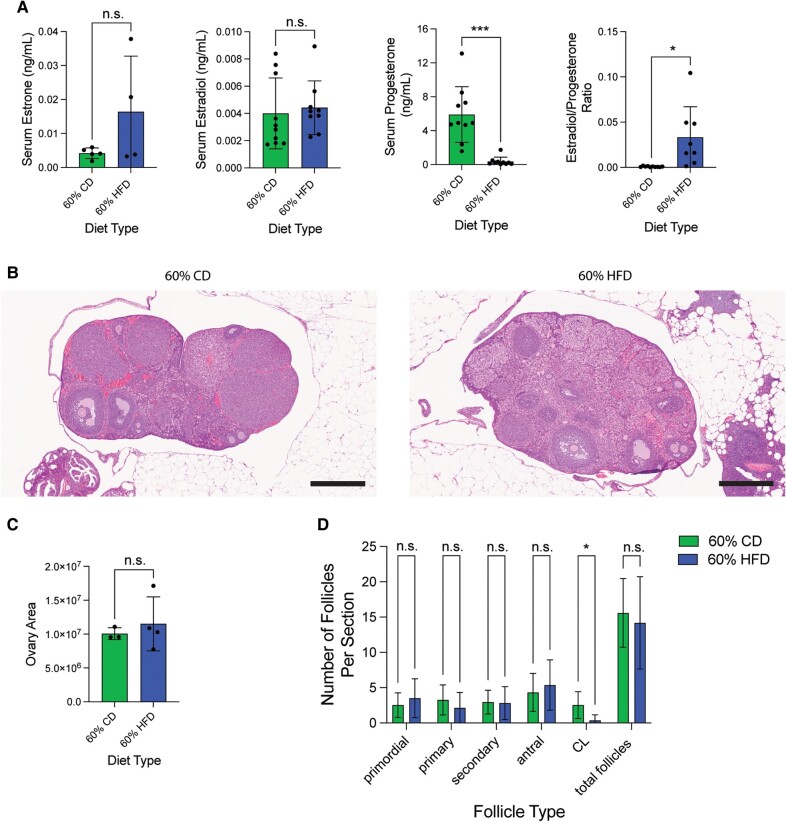
Estrous cycle stage-controlled mice on 60% HFD display unopposed estrogen and decreased corpora lutea (A) Serum estrone (datapoint; n = 5 for CD; n = 4 for HFD), estradiol (datapoint; n = 10 for CD; n = 9 for HFD), progesterone (datapoint; n = 10 for CD; n = 10 for HFD), and estradiol-to-progesterone ratio (datapoint; n = 10 for CD; n = 8 for HFD) levels (ng/mL) from estrus-staged mice after 30 to 37 weeks on either 60% HFD or matched-CD diet. Measurement (datapoint; total measured is n = 10 for CD and n = 11 for HFD) represents each mouse (bar = mean ± SD). Two-tailed unpaired t-test statistic for estradiol, and two-tailed unpaired t-test statistic with Welch's correction for estrone, progesterone, and estradiol-to-progesterone ratio. (B) Representative H&E stain of mouse estrus-staged ovarian tissue for each diet type. 5 × magnification; scale bar = 500 µm. (C) Largest histological ovarian area for each mouse after 30 to 37 weeks on diet. Measurement (datapoint; n = 4 for CD; n = 3 for HFD) represents each mouse (bar = mean ± SD). Two-tailed unpaired t-test statistic. (D) Average number of different follicle types per histological section in each diet-treatment type (n = 19 slides for CD; n = 22 slides for HFD). Bar = mean ± SD. Two-tailed unpaired t-test statistic for all follicle types except CL. Two-tailed unpaired t-test statistic with Welch's correction for CL. *P < .05; **P < .01; ***P < .001; ****P < .0001.
Abbreviations: CD, control diet; CL, corpora lutea; H&E, hematoxylin and eosin; HFD, high-fat diet.

