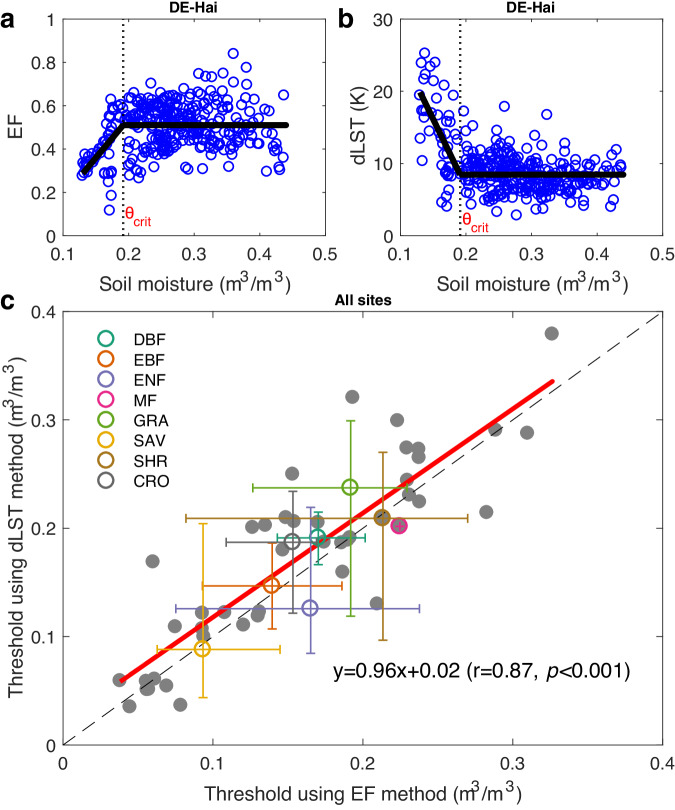
Fig. 1. Quantifying the critical soil moisture (SM) threshold during soil dry-downs using the evaporative fraction (EF)–SM method and the land surface temperature diurnal amplitude (dLST)–SM method.
An example of estimating SM thresholds (θcrit) from the EF–SM method (a) and the dLST–SM method (b) using all dry-downs at Hainich beech forest site (DE-Hai, Supplementary Table 1). c Comparison between the SM thresholds estimated from the dLST–SM method and EF–SM method across all sites. The median and the 25th, 75th percentiles are shown for each biome. The dashed line is the 1:1 line while the red line is fitted line using least squares regression.

