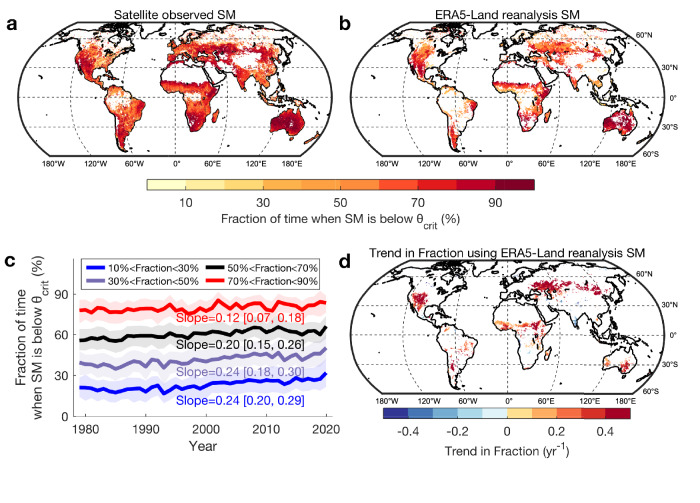
Fig. 4. The global distribution and trend in the fraction of time when soil moisture is below the critical soil moisture threshold (θcrit).
a, b The global distribution of the fraction of time when soil moisture (SM) is below θcrit using satellite observed SM (median values from SMAP-IB, SCA-V and SMOS-IC) and ERA5-Land reanalysis SM during 2016–2020. c Annual time series of the fractions of time when SM is below θcrit in regions with different fraction bins over 1979–2020. The trend (Sen’s slope) and its 95% confidence interval are detected using the nonparametric trend test technique (Mann–Kendall test; p < 0.05). The solid line shows the median value while the shading bounds the interval of the 25th to 75th percentiles. d Spatial patterns of the temporal trend in the fraction of time when SM is below θcrit with white indicating those areas with no significant changes (Mann–Kendall test; p > 0.05) or >10% land cover changes during 1982–2016100, and colored pixels indicating areas with significant trends (p < 0.05).

