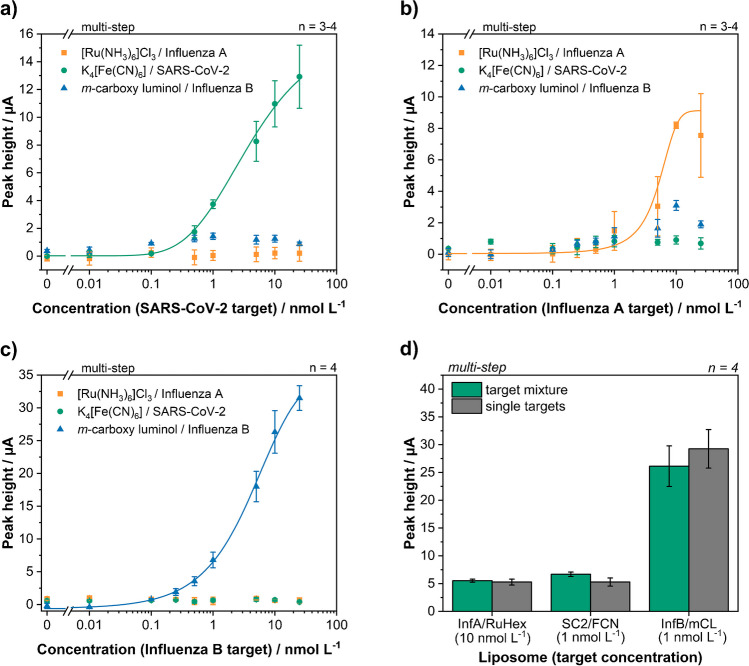
Fig. 5.
Multiplex dose-response curves for SC2 target (a), Inf A target (b) and Inf B target (c) in a concentration range between 0 and 25 nmol L−1. The matching liposome was always used first to simulate the worst-case scenario with the most amount of non-specific binding. (d) Comparison between a multiplex assay with all three targets present and the sum of three individual, multiplex assays with just one target present. Target concentrations and liposome incubation order were kept the same

