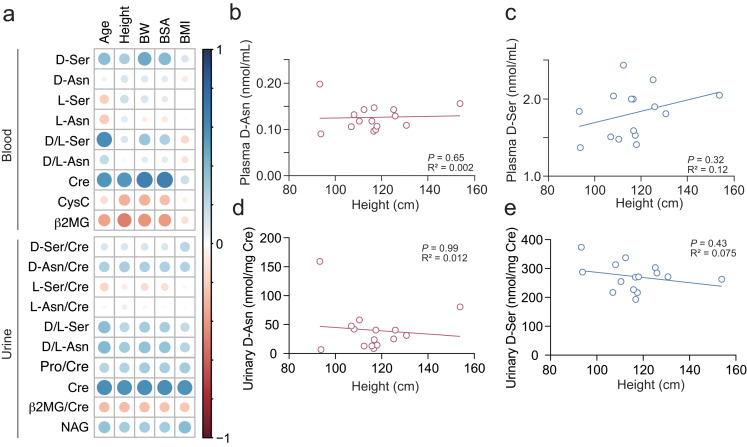
Fig. 4.
Correlations of plasma/urinary amino acid enantiomers with age or body size in non-CKD children. (a) Heatmap shows Spearman’s correlation coefficient between plasma/urinary amino acid enantiomers or existing kidney parameters and age / body size in control children (n = 15). BW, body weight; BSA, body surface area; BMI, body mass index. (b-e) Simple linear regression shows associations of plasma/urinary d-asparagine (b, d) or d-serine (c, e) with heights of control children (n = 15)

