

Summary
The fine control of synaptic function requires robust trans-synaptic molecular interactions. However, it remains poorly understood how trans-synaptic bridges change to reflect the functional states of the synapse. Here, we develop optical tools to visualize in firing synapses the molecular behavior of two trans-synaptic proteins, LGI1 and ADAM23, and find that neuronal activity acutely rearranges their abundance at the synaptic cleft. Surprisingly, synaptic LGI1 is primarily not secreted, as described elsewhere, but exo- and endocytosed through its interaction with ADAM23. Activity-driven translocation of LGI1 facilitates the formation of trans-synaptic connections proportionally to the history of activity of the synapse, adjusting excitatory transmission to synaptic firing rates. Accordingly, we find that patient-derived autoantibodies against LGI1 reduce its surface fraction and cause increased glutamate release. Our findings suggest that LGI1 abundance at the synaptic cleft can be acutely remodeled and serves as a critical control point for synaptic function.
Keywords: synapse, trans-synaptic connections, neurotransmission, optical sensors, LGI1, ADAM23, epilepsy, anti-LGI1 limbic encephalitis
Graphical abstract
Highlights
-
•
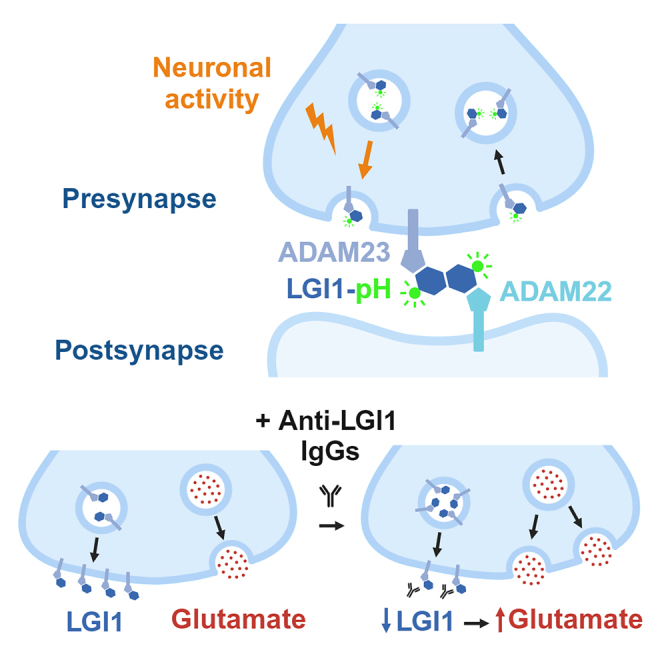
Neuronal activity translocates LGI1 and ADAM23 to the presynaptic surface
-
•
Stable cleft localization of LGI1 depends on the history of synaptic activity
-
•
LGI1 abundance at the synaptic cleft controls glutamate release
-
•
Anti-LGI1 antibodies reduce synaptic surface LGI1 and increase glutamate release
Cuhadar et al. find that the abundance of LGI1 at the presynaptic surface controls glutamatergic transmission. Synaptic surface LGI1 increases with neuronal activity but is reduced by patient-derived autoantibodies against LGI1. Results support the role of LGI1 in the control of synaptic transmission and its causal role in epilepsy.
Introduction
Physiological function of the mammalian brain relies on the orchestrated activity of a myriad of synapses across neural circuits. Neurotransmission requires not only that individual pre- and post-synaptic sites work properly, but also that they are accurately connected in space through well-defined trans-synaptic interactions.1,2,3,4,5,6,7,8 The fine control of the trans-synaptic molecular architecture is essential to maintain and dynamically modulate synaptic efficiency,9 and it is now well established that distortions of trans-synaptic signaling cause synaptic dysfunction in several neuropsychiatric disorders, including epilepsy.5 However, understanding how the molecular profile of a well-functioning synaptic connection is established, maintained and dynamically adjusted over time, and how altering these processes results in diseased brain states remains an unsolved research challenge.
The function of a particular trans-synaptic complex, formed between leucine-rich glioma-inactivated 1 (LGI1) and its receptors ADAM22 and ADAM23, is essential to sustain circuit function in vivo, as lack of LGI1 function causes epilepsies of both genetic and autoimmune etiology. Genetic mutations in LGI1 cause autosomal dominant lateral temporal lobe epilepsy10 and autoantibodies against LGI1 cause a form of limbic encephalitis (LE) associated with cognitive decline and seizures.11,12,13,14 Ablating LGI1 expression only in excitatory neurons causes epilepsy in mice, while selectively removing it from inhibitory neurons does not,15 suggesting an important presynaptic role for LGI1 in the regulation of excitatory transmission in the brain. At the excitatory synaptic cleft, LGI1 acts as the molecular connector between presynaptic ADAM23 and postsynaptic ADAM22 receptors, linking structurally and functionally pre- and postsynaptic sites.11,16 At the presynaptic level, LGI1-ADAM23 has been proposed to facilitate the function of the potassium channel Kv1.1, modulating the shape of the presynaptic action potential to curb activity-driven Ca2+ entry and reduce glutamate release.17,18,19,20 Congruently, loss of LGI1 globally leads to increased glutamate release,15,21 which provides a hypothesis on how LGI1 dysfunction could cause epilepsy. However, at the postsynaptic site LGI1-ADAM22 interacts with PSD-95 to enhance AMPA and NMDA receptor function.22,23,24 In contrast to the increase in presynaptic function, loss of LGI1 decreases postsynaptic processing of neurotransmission, which has led to propose that LGI1 controls postsynaptic glutamate receptor function exclusively in inhibitory neurons.22 In this alternative model, LGI1 dysfunction decreases excitatory activation of inhibition to cause epilepsy.
While several studies using in vivo models have made clear that loss of LGI1 causes increased brain excitation and epilepsy,15,23,25,26,27 controversy remains on how LGI1 localization and function can control the physiology of excitatory function, in part due to the lack of powerful tools to study the molecular behavior of LGI1 in single synapses. To tackle this issue, we developed an optical tool, LGI1-pHluorin (LGI1-pH), which allows monitoring LGI1 surface localization and trafficking in live firing synapses. Using this tool, we found that neuronal activity drives LGI1 translocation at presynaptic terminals, leading to an increased accumulation of LGI1 at the synaptic cleft of firing synapses. Increasing synaptic surface LGI1 levels narrows the presynaptic action potential (AP) waveform, which in turn reduces AP-driven Ca2+ entry and glutamate release in a synapse-specific manner, suggesting that activity-driven molecular rearrangement of LGI1 trans-synaptic bridges modulates excitatory transmission correlatively to synaptic firing rates. Moreover, impairing LGI1 function by the presence of pathological autoantibodies against LGI1 led to a decrease in LGI1-pH at the surface and a corresponding increase in glutamate release. These experiments reveal a critical role for neuronal activity in shaping the molecular architecture of trans-synaptic connections, framing future investigations on the molecular control of neurotransmission and brain excitability by LGI1 and other trans-synaptic molecules.
Results
Neuronal activity drives LGI1 translocation to the synaptic surface
Early studies identified LGI1 as a secreted protein by expressing it in heterologous cell lines and measuring its constitutive secretion into the culture medium, showing that several pathological mutations inhibited LGI1 secretion in this system.28,29 However, while heterologous cell secretion assays can identify how mutations affect cellular trafficking,27,30,31,32,33 they fail to mimic neuronal activity patterns and subcellular signaling pathways in neurons. Alternatively, expression of His-Flag-tagged LGI1 has been used to visualize LGI1 at the surface of fixed neurons,23 but this method lacks the spatiotemporal resolution to visualize the molecular behavior of LGI1 at the synaptic cleft in living neurons. To circumvent these limitations and explore with higher precision how the presence of LGI1 at the synaptic cleft is regulated, we developed an optical tool that allows selective visualization of surface-localized LGI1 molecules in live synapses. We fused pHluorin, a pH-sensitive variant of GFP, to the C-terminal end of LGI1 (see STAR Methods). The fluorescence of pHluorin is quenched by acidic pH, which is typically found in the lumen of intracellular compartments such as synaptic vesicles, dense-core vesicles, secretory granules, or presynaptic endosomes. However, when pHluorin is exposed to the extracellular neutral pH, it becomes ∼100 times more fluorescent34 (Figure 1A). We expressed LGI1-pH in primary excitatory hippocampal neurons that were co-cultured with astrocytes, a system that optimizes the optical access to single synapses.35,36,37 Selective expression in excitatory neurons was achieved by using the CaMKII promoter.38 Co-expression of LGI1-pH together with the presynaptic marker synapsin-mRuby confirmed the expected preferential localization of LGI1-pH at the synaptic surface of live neurons, showing ∼40% more relative synapse fluorescence at rest than a construct that simply expresses pHluorin in the entire surface of the neuron (Figures S1A and S1B).
Figure 1.

Neuronal activity drives LGI1 translocation to the synaptic surface
(A) Diagram showing LGI1-pHluorin (LGI1-pH), which is not fluorescent when located intracellularly (shown in gray) but becomes fluorescent when exposed at the surface (shown in green). Synapsin-mRuby is a presynaptic marker.
(B) LGI1-pH signals in presynaptic boutons identified by synapsin-mRuby (left, colored in red) at rest (middle image) and during a 20 AP 20 Hz stimulus (displayed as a kymograph, right; pseudocolor scale shows low to high intensity). Timescale bar, 3 s. Scale bar, 2.4 μm.
(C) LGI1-pHluorin response to 20 AP 20 Hz stimulus shown as average trace.
(D) Example traces of LGI1-pH response to 50 Hz electrical stimulation during 20 s in control or in the presence of pH 5.5 solution buffered with MES.
(E) LGI1-pH response during 1,000 AP 50 Hz electrical stimulation (ΔF) colocalizes with presynaptic bouton marker synapsin-mRuby; pseudocolor scale shows low to high intensity. Scale bar, 4.8 μm.
(F) Average traces of LGI1-pH responses to 1,000 AP 50 Hz stimulation in synaptic boutons versus axonal regions of the same neurons.
(G) Quantification of peak LGI1-pH response shown in (F) from axonal versus bouton regions. Table S1 shows number of experiments and replicates, means and error, and statistical tests used.
We next quantified the fraction of LGI1 present at the synaptic surface or inside presynaptic intracellular compartments by quenching the surface fraction using a non-permeable acidic solution and subsequently revealing the total amount of LGI1-pH using ammonium chloride (NH4Cl) (see STAR Methods).34 Surprisingly, our estimates showed that ∼70% of synaptic LGI1 was located in presynaptic intracellular compartments (Figure S1C), an unexpectedly high fraction for a surface-localized neuronal protein.39 We hypothesized that such a large internal pool ideally facilitates regulating the abundance of LGI1 at the synaptic surface on demand, permitting the translocation of a significant amount of LGI1 molecules during certain functional states, such as neuronal activity. To test this hypothesis, we electrically stimulated LGI1-pH-expressing neurons to mimic physiological firing paradigms of hippocampal place neurons in vivo, such as firing at 20 Hz for 1 s,40 and found translocation of LGI1 to the presynaptic neuronal surface in isolated boutons of the synaptic arborization (Figures 1B and 1C). We next verified that such presynaptic increase in LGI1-pH signal arose from surface accumulation. To facilitate LGI1 translocation in the majority of boutons, neurons were stimulated at 50 Hz during 20 s and we subsequently confirmed that such increase was fully quenched by rapid perfusion of a low-pH solution (Figure 1D; see STAR Methods). We noticed that LGI1-pH translocation to the surface occurred preferentially in synapses (Figure 1E). Quantifying changes in fluorescence in synapses versus inter-synapse axonal regions of the same axons revealed that virtually no change is found in the axon outside of presynaptic sites (Figures 1F and 1G). Conversely, no increase was observed in somas and dendrites as consequence of back-propagated action potentials, which on the contrary generated a slight decrease in the signal (Figure S1D). Such decrease, however, is likely a reflection of activity-driven acidification of the endoplasmic reticulum, where LGI1-pH is transiently located while being synthetized, as an ER-localized pHluorin36 construct also reports a decrease in fluorescence during same stimulation paradigms (Figure S1E). Moreover, estimates of compartment pH obtained from neurons expressing ER-pHluorin or LGI1-pH in the dendrites appeared indistinguishable (Figure S1F). Taken together, these results show that neuronal activity controls LGI1 translocation to the synaptic surface at the presynapse.
LGI1 is not located in synaptic vesicles
We next asked whether the intracellular pool of LGI1 is located in a structure different from synaptic vesicles (SVs) and examined this hypothesis with several complementary approaches. First, leveraging established methods to quantify pH inside organelles harboring pHluorin,34 we found that the pH of the locale containing presynaptic LGI1 was around ∼6.1 in hippocampal neurons. This internal compartment, to which we will refer as LGI1 vesicles, presented a significantly more alkaline pH than our pH estimates from SVs labeled with vGlut1-pHluorin (Figure 2A). Moreover, LGI1-pH exocytosis events appeared asynchronous and were delayed in many of the responding boutons (Figure 2B, lower panel) in contrast to SV exocytosis (Figure 2B, top panel). LGI1-pH exocytosis events were delayed on average ∼4 s, being able to be delayed up to 20 s in some boutons (Figure 2C). LGI1-pH exocytosis events presented dynamics compatible with univesicular exocytosis in at least one-third of the recorded events, while the remaining two-thirds resembled dynamics of multivesicular exocytosis (Figure S2A, left panel; see STAR Methods). A series of representative examples for each type of translocation, showing one, two, or multiple exocytosis events are shown in Figures S2B–S2D, as well as the likelihood of each event type depending on the stimulation paradigm (Figure S2A). Stimulating for shorter periods of time mimicking physiological firing paradigms, such as firing at 20 Hz for 1 s (Figure 1C), led uniquely to univesicular exocytosis (Figure S2A, right panel), suggesting that this may be the most likely mode of exocytosis occurring physiologically.
Figure 2.

LGI1 is not located in synaptic vesicles
(A) Presynaptic intracellular compartment pH estimated using vGlut-pH (SV) and LGI1-pH (LGI1 vesicles).
(B) vGlut-pH and LGI1-pH signals in boutons identified by synapsin-mRuby expression (left, colored in red) at rest (middle image) and during a 1,000 AP 50 Hz stimulus (displayed as a kymograph, right; pseudocolor scale shows low to high intensity). Timescale bar, 5 s. Scale bar, 2.4 μm.
(C) Quantification of exocytosis delay in vGlut-pH versus LGI1-pH.
(D) Left: example traces of vGlut-pH (upper traces in black) and LGI1-pH (lower traces in blue) responses to 50 Hz stimulation before (continuous line) and after (dotted line) 10 min of 2 mM EGTA-AM treatment on the same neuron. Right: quantification of the remaining response of vGlut-pH and LGI1-pH after EGTA-AM treatment. 1 = no EGTA effect; 0 = complete block by EGTA.
(E) Left: responses to bafilomycin 500 nM in vGlut-pH and LGI1-pH transfected neurons. Changes are normalized to the maximal fluorescence change, obtained by applying NH4Cl at pH 6.9, the cytosolic pH. Right: quantification for vGlut-pH and LGI1-pH neurons.
(F) Synaptic vesicle exocytosis during 1,000 AP 50 Hz in neurons expressing vGlut-pH with or without co-transfection of dominant-negative (DN) SNAREs or only vGlut-pH but treated for 24 h with tetanus toxin. Data are normalized to maximum fluorescence change per bouton, obtained by applying NH4Cl at pH 7.4.
(G) LGI1 exocytosis during 1,000 AP 50 Hz in neurons expressing LGI1-pH with or without co-transfection of dominant-negative (DN) SNAREs or only LGI1-pH but treated for 24 h with tetanus toxin. Data are normalized to maximum fluorescence change per bouton, obtained by applying NH4Cl at pH 7.4.
(H) Exocytosis block by tetanus toxin (TeNT), calculated in neurons expressing vGlut-pH or LGI1-pH as 1 – (TeNT response/average untreated response). Table S1 shows number of experiments and replicates, means and error, and statistical tests used.
Next, we reasoned that LGI1 exocytosis delays in individual boutons could be the consequence of a looser coupling between activity-driven Ca2+ entry and binding to the Ca2+ sensor present in LGI1 vesicles. To test this hypothesis, we incubated neurons expressing either vGlut-pH or LGI1-pH in the presence of EGTA-AM, a calcium chelator that impairs channel-vesicle coupling to greater extents in loosely coupled exocytosis mechanisms.41 EGTA-AM exposure and concentration used had a relatively small impact on SV exocytosis during prolonged stimulation at 50 Hz, allowing us to test whether in such conditions LGI1-pH exocytosis was significantly affected. Our results revealed that LGI1-pH vesicle exocytosis was greatly blocked by the presence of EGTA-AM, thus revealing a much looser coupling to Ca2+ for exocytosis (Figure 2D).
We reasoned that, if LGI1 vesicles are not SVs, they should not contain neurotransmitter transporters. Neurotransmitter transporters in SVs generate a steady-state H+ leak that is counteracted by vesicular H+-ATPase (vATPase) function.42 Acutely blocking vATPases using bafilomycin reveals such an H+ leak, which can be quantified using pHluorin (Figure 2E, black trace). We reasoned that, if LGI1 vesicles are not SVs, they should not present an H+ leak. We applied bafilomycin in neurons expressing LGI1-pH and confirmed that LGI1 vesicles do not constitutively leak protons, indicating that they do not contain neurotransmitter transporters (Figure 2E).
Lastly, we reasoned that if LGI1 vesicles are distinct from SVs, different SNARE proteins may control their exocytosis. We co-transfected different dominant negative SNAREs43 with either vGlut-pH or LGI1-pH and quantified cumulative exocytosis changes of single neurons during activity. First, we confirmed that SNAP25 and Syntaxin-1A were required for SV exocytosis, as described elsewhere,44 while SNAP29 and Syntaxin-4 did not impact this process, as expected43 (Figure 2F). Comparatively, lack of Syntaxin-4 function resulted in a significant reduction in LGI1-pH exocytosis, which was blocked also by DN-Syntaxin-1A but not by DN-SNAP25 (Figure 2G). These results uncover a different mechanistic regulation between SV and LGI1 exocytosis. Presynaptic exocytosis of Cerebellin-1, a secreted trans-synaptic protein, requires the function of Syntaxin-4 and SNAP29, and it is insensitive to tetanus toxin (TeNT), which cleaves VAMP1-3 proteins.43 In contrast, we found that LGI1 exocytosis was not significantly impaired by the expression of DN-SNAP29 and applying TeNT partially blocked LGI1 translocation (Figure 2G), suggesting that Cerebellin-1 and LGI1 do not rely on the same mechanisms for their presynaptic exocytosis. Interestingly, LGI1 exocytosis was not fully blocked by TeNT (Figure 2H), suggesting that it may partially rely on TeNT-insensitive VAMP proteins for exocytosis. Taken together, these series of experiments demonstrate that LGI1 vesicles are not SVs, despite being present at presynaptic sites and being able to undergo activity-driven exocytosis.
LGI1 in neurons is primarily not secreted but trafficked bound to ADAM23
LGI1 is considered to be a secreted protein and, indeed, it can be found in the conditioned media of primary neurons25 and organotypic slices.45 We next quantified to what extent the dynamics of activity-driven LGI1 exocytosis resemble those of a canonical secreted protein, such as Neuropeptide Y (NPY).46 Field stimulation in neurons expressing NPY-pHluorin elicited a series of asynchronous exocytosis events whose dynamics showed a rapid increase and decrease in fluorescence (Figures S3A and S3B). Such fast decay in the signal after each exocytosis event is expected for a protein secreted into the medium, as it rapidly diffuses away from the secretion location.46 In contrast, we noted that individual LGI1-pH exocytosis events presented a much more sustained fluorescence over time after the initial increase (see examples in Figures S2B–S2D), indicating that molecules exocytosed stay at the secretion location for much longer times. To robustly quantify the dynamics of LGI1-pH and NPY-pH univesicular exocytosis events, we aligned the temporal occurrence of asynchronous univesicular exocytosis responses from each protein to obtain a representative average of the dynamics of single univesicular exocytosis events (Figures 3A and 3B; see STAR Methods). This analysis showed that LGI1-pH fluorescence remained on average mostly unchanged during at least 20 s after exocytosis, in sharp contrast to NPY-pH, which by that time had already returned to baseline (Figure 3C). Thus, on average, LGI1 does not behave as a canonical secreted protein. Careful examination of 377 separate LGI1-pH uni- or multi-vesicular exocytosis events showed that, while none of the events presented dynamics resembling canonical secretion (i.e., NPY-pH), ∼8% events presented mixed kinetics with partial secretion-like decreases in fluorescence (Figures S3C and S3D; see STAR Methods), which could be compatible with the dissociation of LGI1-pH from the synaptic surface and its diffusion into the medium. While these events were uncommon (29/377 boutons in 7 neurons), they show that LGI1 can dissociate from the surface and thus be present in the extracellular media, in agreement with previous work in neuronal cultures25 and organotypic slices.45 These results, however, unexpectedly suggest that when LGI1 is translocated to the neuronal surface it does not behave as a canonical secreted protein, as hypothesized elsewhere.11,47,48
Figure 3.

LGI1 is primarily not secreted but exo- and endocytosed bound to ADAM23
(A) Average of normalized univesicular exocytosis events from LGI1-pH, obtained by aligning temporally what otherwise would be asynchronous responses. Each single-bouton response was normalized to maximum fluorescence of the peak per event, averaging all the normalized events.
(B) Average of normalized univesicular exocytosis events from NPY-pH, obtained with the same analysis pipeline as in (A).
(C) Quantification of the relative fluorescence in boutons expressing either LGI1-pH or NPY-pH after exocytosis (peak = 1; baseline = 0).
(D) Example traces of LGI1-pH responses to MES (pH 5.5) and NH4Cl (pH 7.4) before (gray) and after (green) electrical stimulation.
(E) Quantification of total LGI1-pH levels before and after 1,000 AP 50 Hz stimulation.
(F) Example traces of LGI1Y433A-pH responses to Tyrode’s solution at pH 5.5 buffered with MES and NH4Cl (pH 7.4) before (light brown) and after (dark brown) electrical stimulation.
(G) Quantification of total LGI1Y433A-pH levels before and after 1,000 AP 50 Hz stimulation.
(H) Diagram showing ADAM23-pHluorin (ADAM23-pH), which is not fluorescent when located intracellularly (shown in gray) but becomes fluorescent when exposed at the surface (shown in green).
(I) ADAM23-pHluorin signals in presynaptic boutons identified by synapsin-mRuby expression (left, colored in red) at rest (middle image), and during a 1,000 AP 50 Hz stimulus (displayed as a kymograph, right; pseudocolor scale shows low to high intensity). Timescale bar, 10 s. Scale bar, 2.4 μm.
(J) Quantification of exocytosis delay in neurons expressing vGlut-pH or ADAM23-pH. Note that the data shown for vGlut-pH are already shown in Figure 2C but displayed here again for clarity when comparing it to ADAM23.
(K) Vesicle pH in neurons expressing vGlut-pH or ADAM23-pH.
(L) Average dynamics of normalized univesicular exocytosis events from ADAM23-pH, obtained by aligning temporally what otherwise would be asynchronous responses. Each single-bouton response was normalized to maximum fluorescence of the peak per event, averaging all the normalized events. Table S1 shows number of experiments and replicates, means and error, and statistical tests used.
To quantitatively explore to what extent activity may drive LGI1 secretion, we measured the total content of presynaptic LGI1-pH before and after strong stimulation. We (1) revealed the total pool of presynaptic LGI1 in the presence of NH4Cl in unstimulated neurons, (2) electrically stimulated them to expose ∼30% of intracellular LGI1-pH (as in Figures 2B), and (3) measured again the total pool of LGI1-pH within the same presynaptic sites. These experiments, however, did not reveal any detectable change in the total amount of LGI1-pH after stimulation (Figures 3D and 3E), showing that the total amount of LGI1-pH in a bouton remains constant despite translocation. This result makes it unlikely that the gradual decay in LGI1-pH fluorescence observed after exocytosis is caused by LGI1-pH dissociation. On the contrary, these results indicate that the reduction in fluorescence observed after exocytosis is likely caused by endocytosis and reacidification of recovered LGI1-pH molecules.
Given that LGI1 does not contain a transmembrane domain, we reasoned that its ability to undergo exo- and endocytosis has to be conferred through an interaction with a transmembrane receptor. At the presynaptic site, LGI1 interacts with ADAM23, a single-transmembrane receptor.49 Incorporating the Y433A mutation in LGI1 disrupts such interaction,16 which would suggest that LGI1Y433A-pH may behave as a secreted protein. We quantified the total pool of LGI1Y433A-pH in synapses before and after stimulation and found the total amount of LGI1Y433A-pH was significantly reduced after activity (Figures 3F and 3G). This suggests that if LGI1 cannot properly bind ADAM23, LGI1 molecules translocated during activity are more likely to be secreted. Supporting this idea, careful examination of 477 events measured from 11 independent neurons expressing LGI1Y433A-pH identified that ∼15% events presented mixed kinetics with partial secretion-like decreases in fluorescence, roughly 2-fold more than wild-type LGI1-pH (Figure S3E).
We next hypothesized that, if LGI1 requires ADAM23 for trafficking, ADAM23 should also undergo activity-driven translocation with similar dynamics. To test this, we designed a construct in which we cloned pHluorin after the signal peptide of the N terminus of ADAM23, generating pHluorin-ADAM23 (ADAM23-pH, Figure 3H). Neuronal activity robustly drove asynchronous ADAM23-pH translocation on demand to the presynaptic surface (Figure 3I), presenting significant delays to undergo exocytosis, similar to LGI1 (Figure 3J). Moreover, ADAM23-pH located mostly in intracellular compartments at the presynapse presented a pH more alkaline than SV pH (Figure 3K). Lastly, we aligned asynchronous univesicular ADAM23-pH exocytosis responses and obtained the representative average of the dynamics single univesicular exocytosis events, which presented similar kinetics to univesicular LGI1-pH exocytosis dynamics (Figure 3L). These results support the idea that during activity LGI1 is not secreted but undergoes exo- and endocytosis bound to ADAM23.
Activity controls the stable localization of LGI1 at the synaptic surface
On average, LGI1-pH univesicular exocytosis events did not fully return to the baseline after endocytosis, suggesting that a fraction of LGI1 molecules were stabilized on the synaptic surface after activity (Figure 3A). This was also apparent in global LGI1-pH fluorescence changes in presynaptic arborizations of single neurons (Figure 4A). This result implies, however, that each exocytosis event should expose on average several LGI1-pH molecules. To confirm this hypothesis, we used quantitative measurements of purified single EGFP molecules to estimate the number of LGI1-pH molecules exposed per univesicular exocytosis event. We first imaged purified single EGFP molecules in a coverslip, which appeared as diffraction-limited spots (Figure S4A). Analysis of the intensity distribution of ∼1,500 individual spots revealed a quantized distribution with a unitary size of ∼535 arbitrary units (Figure S4A), which we attributed to the fluorescence of a single EGFP molecule. Next, we imaged LGI1-pH exocytosis and quantified changes in fluorescence in univesicular exocytosis events (Figure S4B). Assuming that the brightness of EGFP and pHluorin at pH 7.4 are equal,50,51 exocytosis measurements can be calibrated in terms of the number of EGFP molecules. This estimate indicated that ∼6 LGI1-pH molecules were exposed per univesicular exocytosis event (Figure S4C). While shorter stimulations favored single univesicular exocytosis events (Figure S2A), we captured two subsequent exocytosis events in the same bouton in ∼12% of the cases (42 out of 331 events; Figures S2A and S4D). We quantified the relative amplitude of the first and second exocytosis events and found similar responses (median of population = 1.03; Figure S4E), indicating that the amount of LGI1-pH present in different LGI1 vesicles of the same bouton is on average constant. These results support the idea that each LGI1 vesicle may contain several LGI1 molecules, which in turn can enable synaptic stabilization of a fraction of the molecules translocated.
Figure 4.

Stable localization of LGI1 at the cleft depends on the history of synaptic activity
(A) Example response of a single presynaptic arborization expressing LGI1-pH during 1,000 AP 50 Hz electrical stimulation. Dotted line indicates the baseline before stimulation.
(B) LGI1-pH fraction present at the synaptic surface before and after electrical stimulation (1,000 AP 50 Hz) for individual neurons.
(C) Example response of a single presynaptic arborization expressing vGlut-pH during 1,000 AP 50 Hz electrical stimulation. Dotted line indicates the baseline before stimulation.
(D) vGlut-pH fraction present at the synaptic surface before and after electrical stimulation (1,000 AP 50 Hz) for individual neurons.
(E) Example images of LGI1-pHluorin expression levels at the surface (middle panel) and total (right panel, revealed by NH4Cl pH 7.4 in control neurons versus neurons treated with TTX for 5 days. Presynaptic boutons are identified by synapsin-mRuby (left, in red). Pseudocolor scale shows low to high intensity. Scale bar, 4.8 μm.
(F) Fraction of LGI1-pH present at the synaptic surface in control versus neurons treated with TTX for 5 days.
(G) Fraction of ADAM23-pH present at the synaptic surface in control versus TTX-treated neurons.
(H) Diagram showing experimental flow to biochemically isolate endogenous synaptic cleft proteins.
(I) Example blot for total biotinylation rates in neurons expressing LRRTM-HRP treated with or without TTX for 5 days; minus signal (−) indicates a negative control in which reaction was not run.
(J) Example western blot experiment showing endogenous LGI1 levels isolated from the synaptic surface in control and neurons treated with TTX for 5 days (top panel), with the same experimental conditions shown in (H). As a control, endogenous levels of GluR1 remained unchanged (lower panel).
(K) Example western blot experiment showing total LGI1 levels in control and neurons treated with TTX for 5 days. V5 shows the expression of LRRTM-HRP-V5 and β-actin is a loading control.
(L) Quantification of endogenous levels of LGI1 at the synaptic surface in TTX-treated neurons.
(M) Quantification of endogenous total levels of LGI1 obtained from whole cell lysate of the experiments shown in (L). Table S1 shows number of experiments and replicates, means and error, and statistical tests used.
To quantify LGI1-pH stabilization at the synaptic surface after activity, we next measured LGI1-pH surface fraction before and after stimulation (see STAR Methods). While total LGI1-pH remains unchanged in the conditions tested (Figures 3D and 3E), LGI1-pH at the synaptic surface was increased by ∼30% when measured 5–10 min after firing (Figure 4B). In a different set of experiments, we stimulated three times longer at the same frequency, which also increased LGI1-pH stabilization by ∼30% (Figure S5A), indicating that activity-driven increases in surface LGI1 may reach a saturation point. As a control, the same stimulation paradigm did not induce surface stabilization of vGlut-pH (Figures 4C and 4D). These results indicate that the presence of LGI1 at the synaptic surface in a given time is controlled by the history of firing of such synapse. To test this hypothesis, we reasoned that inhibiting spontaneous firing in culture for several days should decrease synaptic surface localization of LGI1. We transfected LGI1-pH and 2 days later neurons were treated for 5 days with tetrodotoxin (TTX), a selective inhibitor of neuronal Na+ channels that results in blockage of action potential propagation. We found that LGI1-pH was hardly detectable in the surface of TTX-treated neurons (Figure 4E), which presented a ∼70% reduction in surface localization (Figure 4F). Similar experiments using ADAM23-pH showed the same phenotype, supporting the idea that ADAM23 and LGI1 pHluorin are trafficked together to the synaptic surface (Figure 4G). We confirmed that loss of these proteins at the surface was not a consequence of loss of expression by TTX, as both LGI1-pH and ADAM23-pH total pools were unchanged. In fact, we observed that LGI1-pH was even slightly increased (Figures S5B, and S5C).
To confirm that history of activity controls surface localization of endogenously expressed LGI1, we isolated synaptic cleft proteins in control and TTX-treated neurons using recent technologies for synaptic cleft proximity biotinylation52 (Figure 4H). Cleft proteins were labeled for isolation by expressing a biotinylating enzyme (HRP) in the surface of spines and running a biotinylation reaction for 1 min with an impermeant biotin-phenol52 (Figure 4H). We first confirmed that TTX treatment did not impair synaptic cleft biotinylation rates (Figure 4I). TTX-treated neurons, however, presented a significant reduction in the abundance of endogenous LGI1 at the synaptic cleft (Figures 4J and 4K). As controls, the abundance in the synaptic surface of other synaptic cleft proteins, such as GluR1, remained unchanged, and the total amount of endogenous LGI1 was not affected by TTX treatment (Figures 4L and 4M). Taken together, these experiments show that neuronal activity is a major regulatory element in the control of LGI1 surface localization at excitatory synaptic clefts and show that the extent to which LGI1 is present at the synaptic surface reflects the history of activity of the synapse.
Epilepsy-associated LGI1 mutants present translocation or stabilization defects at the synapse
Loss of LGI1 function at the synaptic surface is thought to cause epilepsy because most pathogenic mutations inhibit LGI1 protein secretion in heterologous cells.10,25,27,30,31 However, a few disease-causing LGI1 mutants can be easily found in the media of transfected heterologous cells,32 and thus what exactly is dysfunctional in these cases remains poorly understood. We reasoned that LGI1-pHluorin should enable straightforward quantitative analyses of the molecular dysfunction of LGI1 disease-causing mutations. We generated a series of LGI1-pHluorin mutants that in HEK cells are known to be secretion defective (C200R, E383A) or secretion positive (S473L, R474Q), together with a mutant (T380A) that remains controversial, as it has been claimed to be both secretion defective27 and secretion positive.32 Mutations associated with epilepsy in humans are typically heterozygous and thus we studied LGI1-pH mutants in the presence of endogenous LGI1 to better understand how each mutant may misbehave at the synapse. We first saw that pHluorin variants of secretion-defective mutants C200R and E383A appeared mostly retained in the neuronal somatic ER and did not undergo activity-driven translocation (Figure 5A, red-colored mutants). In contrast, mutant T380A showed a reduced, yet detectable presence at the synaptic surface (Figure S6A and S6B), and electrical stimulation drove its translocation to the synaptic cleft, although with much less efficiency than wild-type LGI1 (Figure 5A, purple colored). Mutants identified as secretion positive in heterologous systems, such as S473L, Y433A, and R474Q, were found at the synaptic surface in levels comparable with wild-type LGI1 (Figure S6A) and their activity-driven translocation was indistinguishable from wild-type LGI1 (Figure 5A).
Figure 5.

Dysfunctional translocation dynamics and stabilization of epilepsy-associated LGI1 mutants
(A) Average ΔF peak during 1,000 AP 50 Hz stimulation of pHluorin-tagged LGI1 constructs WT, S473L, Y433A, R474Q, T380A, E383A, and C200R. Note that data corresponding to WT LGI1 were already shown in Figure 3A.
(B) pH of intracellular compartments containing pHluorin-tagged LGI1 constructs WT, S473L, Y433A, R474Q, or T380A.
(C) Quantification of fluorescence decay in individual boutons 150 s after exocytosis peak for LGI1-pH constructs WT, S473L, Y433A, R474Q, or T380A. Data per bouton were normalized to maximum fluorescence of the peak response in that bouton.
(D) Average of normalized univesicular exocytosis events during electrical stimulation (1,000 AP 50 Hz) of pHluorin-tagged LGI1 constructs WT, S473L, Y433A, R474Q, and T380A, obtained by aligning temporally what otherwise would be asynchronous responses. Each single-bouton response per condition was normalized to maximum fluorescence of the peak per event, averaging all the normalized events for WT, S473L, Y433A, R474Q, and T380A. Dashed lines in each trace indicate the time at which fluorescence was measured to estimate decay rates. Statistical tests on the dashed lines show the Dunn’s multiple comparisons test of the decay as shown in (C).
(E) Stable synaptic surface LGI1-pH change after 1,000 AP 50 Hz electrical stimulation, measured 5–10 min after stimulation, for WT, S473L, Y433A, R474Q, and T380A. To evaluate whether each particular mutant can be stabilized or not at the synapse surface, each individual condition was tested separately through Wilcoxon matched-pairs signed rank test. Table S1 shows number of experiments and replicates, means and error, and statistical tests used.
We next measured the pH of the presynaptic intracellular compartment where different mutants were located at the presynapse. We found that LGI1T380A was in a compartment significantly less acidic than wild-type LGI1, with a pH ∼7 (Figure 5B). This is likely the consequence of this mutant being in LGI1 vesicles (pH ∼6.1) but also partially retained in axonal ER, which has a pH ∼7.2.36 We also found a reduced number of total LGI1T380A-pH molecules within the presynapse (Figure S6C). Taken together, these experiments suggest that LGI1T380A suffers partial retention in the ER, which results in a reduced number of translocation-competent molecules at presynaptic sites. These data resolve the current controversy around the molecular behavior of this mutant27,32 by demonstrating that its translocation is severely impaired, yet detectable. We confirmed that secretion-competent S473L, Y433A, and R474Q mutants appeared to be expressed in similar levels to wild-type LGI1 at presynapses (Figure S6C), in agreement with their strong capacity to be translocated to the surface during activity (Figure 5A).
Exocytosis of S473L, Y433A, R474Q, and T380A occurred asynchronously in different boutons of the same neuron as expected and thus we again time-locked univesicular events to quantitatively compare translocation dynamics of the different mutants without the contribution of asynchronicity. No distinguishable differences were observed in the short-term decay of fluorescence between the wild-type and the S473L, Y433A, or T380A variants, measured by quantifying the remaining signal 150 s (Figures 5C and 5D) or 210 s after peak responses (Figure S6D). However, we found that the translocation-competent R474Q mutant decayed faster after exocytosis (Figures 5C, 5D, and S6D). The R474Q mutation causes both a block of the LGI1-LGI1 interaction16 and a reduction in LGI1’s affinity for ADAM22,53 disrupting the higher-order assembly of the LGI1-ADAM22/23 complex. It is thus possible that the different translocation dynamics of LGI1R474Q reflect a much reduced probability of establishing new LGI1-ADAM22/23 complexes during synaptic exposure of LGI1R474Q. Interestingly, mutations that block the interaction with ADAM23 (Y433A)16 and ADAM22 (Y433A, S473L)27 without impairing LGI1-LGI1 interactions, presented translocation dynamics indistinguishable from wild-type LGI1 (Figures 5C and 5D). It is possible that this is a consequence of the preserved interaction between LGI1-pH mutants and endogenously expressed wild-type LGI1, which itself binds ADAM22/23 receptors.
We next examined activity-driven LGI1 stabilization capacities of each mutant, which revealed that none were significantly increased at the synaptic surface after 5–10 min of neuronal activity (Figure 5E). This phenotype could be a consequence of their reduced capacity to bind ADAM22 at the postsynapse, known for S473L,27 Y433A,16 R474Q,53 and T380A.32 We next explored whether mutants presented activity-driven secretion, as shown for Y433A. We found that neither S473L, R474Q, nor T380A presented detectable loss of total protein levels after neuronal activity (Figure S6E). Binding to ADAM23 has been shown to be preserved for S473L27,53 and R474Q,53 which further supports that losing interaction with ADAM23 may lead to LGI1 secretion, but if that interaction is preserved, LGI1 is recovered back and no total protein is lost (Figures S6E and S6F). However, we did not detect secretion for LGI1T380A, even though it has been reported to be unable to interact with ADAM23.32 This result, however, is complex to interpret because during stimulation significantly fewer LGI1-pH molecules are translocated (Figure 5A) and the theoretical capacity for secretion, and thus the ability of detecting it, is significantly reduced (Figure S6G).
Given that LGI1 modulates the function of the potassium channel Kv1.1,18−20,54 overexpressing different mutants could impact action potential invasion of axonal boutons differently in each condition, potentially inducing failures of action potential propagation that could drive differences in exocytosis recruitment for each mutant. To control for this, we fused wild-type LGI1 and mutants to pHmScarlet,54 a recently developed red pH-sensitive fluorescent protein, and measured possible action potential failures in axonal boutons using jGCaMP8f.55 We found that individual action potentials propagated equally well in untransfected neurons or neurons expressing wild-type LGI1, secretion-competent (R474Q, T380A), or secretion-defective (E383A) mutants (Figures S7A and S7B). This indicates that differences in exocytosis in each case are not a consequence of differential failures in action potential propagation. Taken together, these experiments demonstrate that our tools provide the field with a powerful approach to dissect the pathogenicity of newly identified LGI1 mutations, which should help define whether new variants identified by molecular genetic testing could indeed cause epilepsy.
LGI1 surface abundance in individual boutons controls glutamate release
Loss of LGI1 increases glutamate release from excitatory hippocampal neurons,21,56 as LGI1 constitutively constrains the function of the potassium channel Kv1.1, curbing activity-driven Ca2+ entry and reducing glutamate release.18,19,20,57 Thus, we reasoned that the extent to which LGI1 is present at the surface of individual boutons should result in proportional synapse-specific readjustments of the magnitude of AP-driven Ca2+ entry and glutamate release. To test this hypothesis, we used LGI1-pHmScarlet to combine single bouton measurements of LGI1 surface localization with activity-driven Ca2+ entry or glutamate release (Figure S8A). Synaptic surface LGI1-pHmScarlet was reduced by TTX (Figure S8B), as observed for LGI1-pH (Figures 4E and 4F) and endogenous LGI1 (Figures 4J and 4K), indicating that LGI1-pHmScarlet fluorescence reflects LGI1 surface localization. We first co-expressed LGI1-pHmScarlet with either jGCaMP8f55 or iGluSnFR358 to measure presynaptic Ca2+ or glutamate release in TTX-treated neurons and found that they presented a ∼30% increase in Ca2+ entry (Figures S8C–S8E) and a ∼50% increase in glutamate release (Figure S8F–S8H). These initial results provided phenotypes compatible with the idea that surface LGI1 abundance may control synaptic function although did not prove a causal relationship between surface LGI1 levels and synaptic function modulation as TTX is known to modulate additional signaling pathways.59
We thus next leveraged the use of an optical voltage sensor, Archon1,60 which robustly replicates voltage changes measured by electrophysiology in patched somas of neurons,61 to quantify directly whether increasing the presence of LGI1 at synapses could modulate locally Kv function. We found that overexpressing LGI1-pHmScarlet resulted in a significantly narrowed presynaptic action potential waveform (Figure 6A), particularly in the end phase of repolarization (Table S1). In contrast, the amplitude of the AP remained unaltered (Figure 6B). Such modulation suggests differences in Kv1 function, as blockade of Kv1.1/1.2 channels broadens the AP waveform at the presynapse.62,63 Given that the most significant modulator of calcium entry during an action potential is the end phase of repolarization,64 we reasoned that this specific narrowing of the AP waveform would curb both AP-driven Ca2+ entry and glutamate release. We overexpressed LGI1-pHmScarlet and found that increasing LGI1 levels decreased both presynaptic Ca2+ entry (Figures 6D and 6E) and glutamate release (Figures 6G and 6H) by 25% and 40%, respectively.
Figure 6.

LGI1 abundance at the synaptic cleft controls the presynaptic action potential waveform, calcium entry, synaptic vesicle cycling, and glutamate release
(A) Presynaptic action potential waveform measured using Archon in control versus LGI1-pHmS-overexpressing neurons.
(B) Comparison of the AP width by quantification of the full width at 0.2 of the peak response of each neuron.
(C) Quantification of peak response of the action potential.
(D) Average of cytosolic calcium entry to 1AP stimulus in control versus LGI1-pHmScarlet-overexpressing neurons.
(E) Quantification of (D).
(F) LGI1-pHmScarlet expression and corresponding Ca2+ entry during 1AP stimulus was performed by grouping individual boutons according to their LGI1-pHmScarlet fluorescence and averaging their corresponding 1AP-evoked Ca2+ entry. Binning size was fixed at n = 212 per group for equivalent sampling, except for controls not co-transfected with LGI1-pHmScarlet (n = 732). Dotted line represents the fitting of the data to a single exponential decay model.
(G) Average traces showing glutamate release in response to 1AP stimulus in control versus LGI1-pHmScarlet-overexpressing neurons.
(H) Quantification of glutamate release to 1AP stimulus in control versus LGI1-overexpressing neurons.
(I) LGI1-pHmScarlet expression anticorrelation to presynaptic glutamate release in single boutons was performed as in (F), using a binning size fixed at n = 216 per group for equivalent sampling, except for controls not co-transfected with LGI1-pHmScarlet (n = 994).
(J) Representative example image of LGI1-pHmScarlet baseline signal (top left) and glutamate release (ΔF) (bottom left) in different synaptic boutons of a single presynaptic arborization. Glutamate release traces for each individual bouton from 1 to 5 (green) and the associated surface LGI1-pHmScarlet level (dotted line, intensity scale on the left) exemplify the correlation observed in (I). Scale bar, 4.8 μm.
(K) Average traces showing synaptic vesicle cycling during 100 AP 10 Hz in control versus LGI1-pH or untagged LGI1 overexpression.
(L) Quantification of synaptic vesicle exocytosis peaks in response to 100 AP fired at 10 Hz in control versus neurons overexpressing LGI1-pH or untagged LGI1. Exocytosis is measured as percentage of SV pool mobilized by stimulation, where 100% is the signal obtained by applying NH4Cl pH 7.4.
(M) Synaptic vesicle pH estimated using vGlut-mOr2 in neurons expressing LGI1-pH or LGI1.
(N) Quantification of endocytosis rates after 100 AP 10 Hz stimulus, measured as the time to reach half the amplitude of the peak response (t half). Table S1 shows number of experiments and replicates, means and error, and statistical tests used.
In our initial experiments we observed that synapses belonging to the same axon presented different levels of surface LGI1 (Figures 1E, 4E, and S1A) and thus we reasoned that individual presynaptic strength could be correlatively modulated by local surface LGI1 abundance in single presynapses. As both jGCaMP8f and iGluSnFR3 allowed us to quantify single AP-driven responses in single synapses with sufficient signal-to-noise, we measured individual synapse surface levels of LGI1-pHmScarlet and the corresponding responses in Ca2+ entry and glutamate release to a single action potential. We first analyzed over 1,300 individual boutons from 21 separate neurons expressing jGCaMP8f and LGI1-pHmScarlet and our data revealed a negative correlation in which higher expression of LGI1 was robustly correlated with lower AP-driven Ca2+ entry (Figure 6F). With a similar approach, we analyzed both LGI1-pHmScarlet fluorescence and single AP-driven glutamate release in individual boutons. We analyzed over 800 individual boutons from 40 separate neurons and we confirmed that presynaptic sites with higher expression of LGI1 at the surface released significantly less glutamate during single action potential firing (Figure 6I). Such modulation was easily identifiable in individual boutons from presynaptic arborizations of single neurons (Figure 6J), supporting the analysis shown in Figure 6I.
As LGI1 modulates action potential waveform, Ca2+ entry, and glutamate release, we next explored the role of LGI1 in controlling SV cycling. We co-transfected red-shifted vGlut-mOrange-265 with LGI1-pH and tested SV cycling during a train of 100 AP triggered at 10 Hz. As expected, we found that exocytosis was reduced by ∼30% when LGI1-pH was overexpressed (Figures 6K and 6L). We also used this paradigm to confirm that the presence of pHluorin in the LGI1-pH construct does not alter the function of LGI1. We tested the impact of overexpressing untagged LGI1 onto SV cycling and observed an impairment in exocytosis indistinguishable from that obtained using LGI1-pH, suggesting that LGI1 function is not impaired by tagging it with pHluorin. Similarly, we confirmed that the presence of LGI1-pH or LGI1 does not alter SV properties, including SV pH (Figure 6M), endocytosis rates (Figure 6N), or SV pool size (Figure S9A). Taken together, results in Figure 6 show that LGI1 surface abundance in individual boutons controls locally the action potential waveform and Ca2+ entry, serving as a modulatory mechanism of glutamate release that controls differentially presynaptic strength in boutons belonging to the same axon.
Patient-derived autoantibodies against LGI1 reduce its surface abundance and increase glutamate release
Autoantibodies against LGI1 cause a form of limbic encephalitis (LE) associated with cognitive decline and seizures,11,12,13,14 although the mechanisms by which these antibodies cause neuronal dysfunction remain poorly understood. In several other autoimmune neurological disorders, autoantibodies bind to their target receptors and cause their internalization and subsequent loss of function.66,67 We reasoned that autoantibodies against LGI1 could induce a reduction in surface abundance of LGI1 at synapses. We obtained plasma from patients suffering from LE together with control plasma (see STAR Methods), purified IgG antibodies, and treated primary cultures expressing LGI1-pH for a week in the presence of purified IgG from both conditions (Figure 7A). We found that the presence of autoantibodies reduced LG1-pH at the synaptic surface by ∼50% when compared with neurons treated with control IgGs (Figures 7B and 7C). This result shows a direct measurement supporting that anti-LGI1 antibodies reduce the presence of LGI1 function at the synaptic surface, thus impairing its function. We confirmed that the total amount of LGI1-pH remained unaltered (Figure 7D) in these conditions. We hypothesized that, contrary to our overexpression experiments (Figure 6), reducing the presence of LGI1 at the synaptic surface should result in increased glutamate release.20 To test this, we treated primary neurons expressing iGluSnFR3 with control or LE IgGs as before and measured AP-induced glutamate release. We found that impairing the function of endogenous LGI1 resulted in significantly higher glutamate release, causing a ∼45% increase (Figures 7E and 7F). The presence of LE IgGs did not modulate glutamate clearance rates at the presynapse (Figure S9B), suggesting an effect solely on glutamate release. Taken together, these experiments show that modulating the presence of endogenous LGI1 at the synaptic surface results in a corresponding change in glutamate release and provide the first experimental evidence suggesting that autoantibodies against LGI1 exert their pathological effect by driving a reduction of surface LGI1 in neurons.
Figure 7.

Anti-LGI1 antibodies reduce LGI1 surface fraction and cause increased glutamate release
(A) Graphic scheme of the protocol followed to treat primary neurons with anti-LGI1 auto-antibodies obtained from plasma of patients with limbic encephalitis.
(B) Example images of LGI1-pH expression levels at the surface (top panel), quenched surface LGI1-pH (middle panel, quenched by application of MES Tyrode’s buffer at pH 5.5) and total LGI1-pH (bottom panel, revealed by NH4Cl pH 7.4) in neurons treated with control IgGs or anti-LGI1 patient-derived IgGs. Scale bar, 7.6 μm.
(C) Quantification of LGI1 abundance in synaptic surface of neurons expressing LGI1-pH and treated with either IgGs from control or anti-LGI1 IgGs from patients with limbic encephalitis.
(D) Total LGI1-pH in neurons incubated with control IgGs versus LGI1 IgGs, measured as peak response in NH4Cl pH 7.4.
(E) Average traces showing glutamate release in response to 1AP stimulus in neurons treated with IgGs from control or anti-LGI1 IgGs from patients with limbic encephalitis.
(F) Quantification of individual peak responses shown in (E). Table S1 shows number of experiments and replicates, means and error, and statistical tests used.
Discussion
A decade of accumulating evidence using in vivo experimental approaches has demonstrated that reductions in LGI1 drive synaptic dysfunction, causing seizures and premature death in rodents. However, how the presence of LGI1 at the synaptic surface is controlled has remained poorly understood. Leveraging the development of novel optical tools to monitor the behavior of LGI1 in single firing synapses, we found that neuronal activity is a robust controller of LGI1 abundance at the synaptic cleft. The history of activity of a neuron is essential for developing appropriate connectivity,68 which requires the formation of strong trans-synaptic interactions to facilitate the function of established synapses.9,69,70 We find that both chronic and acute neuronal activity stably boost LGI1-mediated trans-synaptic bridges and their abundance at the cleft of individual terminals correlatively attunes presynaptic function. Given that optimal synaptic transmission relies heavily on the sub-synaptic molecular architecture,9 our results suggest that neuronal activity may acutely remodel the trans-synaptic molecular landscape to adapt the strength of the connection. Indeed, activity remodels synaptic geometry,71 driving structural changes that could be the consequence of activity-driven adjustments of trans-synaptic molecular networks.
LGI1 is broadly considered as a secreted protein, as when overexpressed in heterologous cells it can easily be found in their media.27,28,29,30,31,32,33 Applying purified LGI1 obtained from heterologous cell media impairs Kv1 function and reduces the intrinsic excitability of CA3 neurons in slices,19 in agreement with the idea that soluble LGI1 can bind available ADAM22/23 receptors.14,18 However, while LGI1 can also be detected in the media of cultured neurons and organotypic slices,25,45 this occurs to much less extent than in heterologous cells.25 In agreement with the latter observation, our data show that the majority of LGI1 molecules exposed during firing do not behave as secreted proteins, but are trafficked to, and retrieved from, the synaptic surface. We propose this is possible through a sustained interaction with ADAM23, which also is exposed to the synaptic surface with similar dynamics to LGI1 during activity. On the contrary, we can detect LGI1 secretion if its interaction with ADAM23 is impaired by the LGI1 mutation Y433A.16 Similarly to what occurs in heterologous cells, which do not express ADAM23,27,28,29,30,31,32,33 we propose that LGI1Y433A cannot be fully retained by ADAM23 in synapses and thus behaves partially as a secreted protein (Figures 3F and 3G). Taken together, our data indicate that while LGI1 is indeed a secreted protein, and it can behave as such, it is unlikely that it is being significantly secreted during its translocation at synapses. This unexpected result challenges the current notion on how LGI1, and possibly other secreted synaptic proteins, are translocated to the synaptic cleft and exert their function.
Mechanisms preventing secretion of LGI1 optimize the metabolic efficiency of its translocation, as the energy spent in its synthesis is not lost if LGI1 molecules that are not successful in forming a trans-synaptic bridge can be recovered back to the terminal through endocytosis. Indeed, evolutionary pressure has optimized neuronal function to favor metabolic efficiency,72,73,74,75 and our results highlight yet another mechanism that ameliorates the presynaptic energetic burden associated with neuronal activity.37,76,77 Moreover, given that on average an LGI1 vesicle will contain six LGI1 molecules (Figure S4C) but only a fraction stabilizes at the synaptic cleft after activity (Figures 4A and 4B), recovering the non-stabilized molecules back to the presynapse should enable subsequent rounds of LGI1 translocation without requiring LGI1 synthesis. We find a relatively high probability of multivesicular exocytosis during trains of action potentials at 50 Hz during 20 s (Figure S2A), which correspondingly translocate on average ∼30% of the total pool of LGI1 molecules to the synaptic surface (Figure 2G). We hypothesize that if that amount of LGI1 was not endocytosed but secreted and lost after translocation, LGI1 protein levels would almost disappear in about 10 rounds of firing at those frequencies (see simulation in Figure S9C). The fact that no LGI1-pH loss is observed experimentally during action potential firing (Figures 3D and 3E) suggests that synapses recover translocated LGI1 molecules by endocytosis, contributing to preserving presynaptic LGI1 pools in the short term. This would liberate synapses from continuously relying on strong de novo LGI1 synthesis and transport from neuronal somas, which are typically located millimeters to centimeters away from the synaptic site.
Taken together, our data indicate that LGI1 does not behave as a canonical secreted protein. This is supported by (1) the fact that dynamics of LGI1 translocation differ significantly from the dynamics of a canonical secreted protein such as Neuropeptide-Y (Figures 3A–3C) and (2) the fact that strong stimulation paradigms translocate large amounts of LGI1 to the surface (Figure 2G) without incurring in LGI1 loss at the synapse (Figures 3D and 3E). Our results, however, are not incompatible with the fact that LGI1 is found secreted in the media of cultured primary neurons25 or organotypic slices.45 First, our optical assays reveal a small proportion of LGI1-pH molecules being secreted or dissociated from synaptic receptors (Figures S3C and S3D), which over time could lead to the detectable presence of LGI1 in the neuronal medium. Second, recent work has shown that 71% of the neuronal secretome is originated by proteolytic shedding of membrane proteins rather than vesicular secretion,45 indicating that the presence of a protein in the extracellular medium does not necessarily imply it was secreted. Moreover, this work demonstrated that the ectodomain of ADAM22 (ECD), which is necessary for LGI1 binding at the postsynapse, is constitutively cleaved, suggesting that such shredding should release of both ECD-ADAM22 and LGI1 that was bound to it in the media.45
Given the clinical importance of LGI1, there is a critical need to develop novel strategies to establish the pathogenicity of newly identified LGI1 genetic variants in the clinic. As current assays only distinguish qualitatively between secretion-competent and -incompetent mutants, deciphering whether a secretion-competent mutant is pathogenic requires laborious experimentation, including co-immunoprecipitation and binding assays to ADAM22/23 receptors.16,32 We provide here a simple quantitative toolkit to robustly test several possible aspects of dysfunction in LGI1 by combining the use of primary neurons and field stimulation. We demonstrate that this approach reveals defects that were previously undetectable for epilepsy-associated mutants: (1) LGI1T380A, despite being defined previously as secretion incompetent,27 translocates partially to the synaptic surface and is partially retained in axonal ER, and (2) LGI1S473L and LGI1R474Q, while they translocate efficiently, they cannot get stably increased in synapses after neuronal activity. Similarly, our tools helped to dissect quantitatively how autoantibodies against LGI1, which cause LE and seizures,11,13 can affect the abundance of LGI1 at the synaptic surface and modulate synaptic function. We found that autoantibodies drive an internalization of LGI1 from the synapse surface, resulting in an increased capacity of glutamate release. These results provide the first direct evidence, to our knowledge, indicating that autoantibodies against LGI1 cause pathology by removing LGI1 molecules from the synaptic surface. This phenotype aligns with results observed in several other autoimmune diseases of the nervous system66,67 and supports the idea that autoantibodies against LGI1 induce the internalization of the protein at synapses, leading to increased glutamate release that could change the excitation-inhibition balance and cause seizures. Thus, the quantitative nature of this methodology provides the field with an improved assay for better understanding the molecular dysfunction of LGI1 and a novel approach for dissecting the pathogenicity of new mutations identified in the clinic.
While it is known that LGI1 dysfunction leads to disease through increased brain excitation, controversy remains on the cellular origins of this imbalance.4,23 Here, we find that the abundance of surface LGI1 in single synapses strongly influences the presynaptic action potential waveform, presynaptic Ca2+ handling, SV exocytosis, and glutamate release (Figure 6). Remarkably, we find that such control is synapse specific. Different presynaptic sites belonging to the same axon present different levels of surface LGI1, which strongly correlate with their variable presynaptic strength (Figure 6J). While in these experiments we modulated LGI1 abundance through overexpression, we found the opposite effect when we reduced the presence of endogenous LGI1 at the synaptic surface using anti-LGI1 antibodies: a reduced the amount of LGI1 at synapses (Figures 7B and 7C) correspondingly drove an increase in glutamate release (Figures 7E and 7F). This suggests that neurons could modulate surface LGI1 levels to functionally adapt glutamatergic transmission in healthy states, but if pathological states alter LGI1 localization at the synaptic surface, those synapses will present excessive glutamatergic transmission, causing circuit imbalance and seizures.
Computational complexity in the brain is thought to benefit from the diversity in presynaptic strength found in diverse neuronal connections78,79 and in different presynaptic sites belonging to the same axon.80,81,82 Principal neurons like pyramidal cells of the hippocampus can present up to 15,000 synaptic contact sites,83 and the ability to individually tune their strength increases the complexity of information that can be transmitted.84 However, the molecular underpinnings enabling such heterogeneity in presynaptic strength, and how such variability is readjusted during different functional states, remain poorly understood. Our work identifies LGI1 as a regulator of presynaptic strength variability and, surprisingly, this modulatory role appears not to be static but adjustable in short timescales. This enables LGI1 to act as an integrator of synaptic function that correlatively attunes synaptic strength to match the history of activity to neurotransmission.
The fact that both LGI1 and its presynaptic receptor ADAM23 can acutely change their abundance at the synaptic cleft during activity suggests that the molecular landscape of the synaptic cleft is plastic in faster timescales than initially thought.85 As these trans-synaptic proteins are not present in typical SVs (Figure 2), our results open up the possibility that the surface abundance of other presynaptic proteins may be regulated by the exocytosis of these alternative vesicles. For example, the presynaptic translocation of a glucose transporter, GLUT4, has been shown to occur from vesicles that are not SVs and whose luminal pH is significantly less acidic,37 as we find for LGI1 (Figure 2A). Thus, future studies dissecting the proteome of LGI1 vesicles surely will provide new insights into defining the dynamic nature of synaptic cleft proteome and the extent to which the surface abundance of certain molecules may modulate synaptic physiology. Taken together, our results open new avenues of research that will define how activity can remodel the trans-synaptic molecular landscape of firing synapses in fast timescales, defining novel molecular mechanisms controlling neurotransmission.
Limitations of the study
Here, we use a co-culture model of neurons and astrocytes to study synaptic function. In the future, it will be interesting to apply the tools presented in this work in brain slices to confirm LGI1-pH translocation in intact tissue. On the other hand, our experiments studying LGI1-pH exocytosis required overexpressing it. While our data studying endogenous LGI1 surface localization at the synaptic cleft is in agreement with data obtained overexpressing LGI1-pH, it will be interesting in the future to tag endogenous LGI1 with pHluorin using CRISPR-Cas9 and examine trafficking events of the endogenously expressed protein. Overall, our work in vitro provides clear evidence at the cellular level supporting activity-driven translocation of the trans-synaptic proteins LGI1 and ADAM23. However, future work confirming these observations in vivo will be necessary to better understand the role of these proteins in health and disease.
STAR★Methods
Key resources table
| REAGENT or RESOURCE | SOURCE | IDENTIFIER |
|---|---|---|
| Antibodies | ||
| Rabbit anti-Lgi1/EPT antibody | Abcam | Cat# ab30868; RRID: AB_776017 |
| Mouse anti-GRIA1 antibody | UC Davis/NIH NeuroMab Facility |
Cat# 75-327; RRID: AB_2877405 |
| Goat Anti-Rabbit IgG (H + L)-HRP Conjugate | BioRad | Cat# 1706515; RRID: AB_11125142 |
| Goat Anti-Mouse IgG (H + L)-HRP Conjugate | BioRad | Cat# 1706516; RRID: AB_11125547 |
| V5 Tag Monoclonal Antibody | Invitrogen | Cat# R960-25; RRID: AB_2556564 |
| Beta Actin Polyclonal Antibody | Thermo Fisher Scientific | Cat# PA5-85271; RRID: AB_2792414 |
| Bacterial and virus strains | ||
| FSW-HRP-V5-LRRTM1 | PF iVector-ICM | Addgene #82536 |
| FSW-HRP-V5-LRRTM2 | PF iVector-ICM | Addgene #82537 |
| Biological samples | ||
| Human LGI1 antibodies | Jena University Hospital | licence # 2019-1415 -Material |
| Chemicals, peptides, and recombinant proteins | ||
| Bafilomycin A1 | Cayman Chemical Company | Item #11038 |
| EGTA-AM | Thermo Fisher Scientific | E1219 |
| Tetrodotoxin citrate (TTX) | Tocris | Cat #1069 |
| Biotin-XX Tyramide Reagent (BxxP) | ApexBio Technology | Cat #A8012 |
| Tetanus toxin from Clostridium tetani | Sigma | T3194 |
| Recombinant Enhanced GFP protein (His tag) | Abcam | ab134853 |
| Papain | Worthington Biochemical | LK003178 |
| DNase I | Roche | 10104159001 |
| Poly-D-lysine | Sigma | P2636 |
| MEM, no glutamine, no phenol red | Thermo Fisher Scientific | 51200038 |
| N21-MAX Media Supplement (50X) | Bio-Techne | AR008 |
| Transferrin | Sigma | 616420 |
| Glutamax | Thermo Fisher Scientific | 35050038 |
| Insulin | Sigma | I6634 |
| Cytosine β-d-arabinofuranoside | Sigma | C1768 |
| Neurobasal™ Medium | Thermo Fisher Scientific | 21103049 |
| BrainPhys™ Neuronal Medium and SM1 Kit | STEMCELL Technologies | 05792 |
| 5′-fluoro-2′-deoxyuridine (FUDR) | Fisher Scientific | 10144760 |
| 6-cyano-7-nitroquinoxaline-2,3-dione (CNQX) | Tocris | 1045 |
| D-(−)-2-Amino-5-phosphonopentanoic acid (AP5) | Tocris | 0106 |
| MES (2-(N-morpholino)ethanesulfonic acid) | Sigma | M3671 |
| ProLong™ Glass Antifade Mountant | Thermo Fisher Scientific | P36982 |
| Lipofectamine™ 2000 Transfection Reagent | Thermo Fisher Scientific | 11668019 |
| Chloroquine diphosphate salt, 98% | Thermo Fisher Scientific | 455245000 |
| Pierce™ Streptavidin Magnetic Beads | Thermo Fisher Scientific | 88817 |
| Biotin | Sigma | B4501 |
| DL-Dithiothreitol (DTT) | Sigma | D9779 |
| Clarity™ Western ECL Substrate | BioRad | 1705060 |
| Clarity Max Western ECL Substrate | BioRad | 1705062 |
| Critical commercial assays | ||
| Q5® Site-Directed Mutagenesis Kit | New England Biolabs | E0552 |
| Pierce™ High Sensitivity Streptavidin-HRP | Thermo Fisher Scientific | 21130 |
| NEBuilder® HiFi DNA Gibson Assembly Master Mix |
New England Biolabs | E2621 |
| p24 ZeptoMetrix Kit | Sigma | 0801111 |
| Experimental models: Cell lines | ||
| HEK293T cells | ATCC | CRL-11268 |
| Experimental models: Organisms/strains | ||
| Sprague-Dawley Rat | Charles River | Strain: Crl:CD(SD) |
| Oligonucleotides | ||
| See Table S2 for oligonucleotides used for site-directed mutagenesis | This paper | N/A |
| Recombinant DNA | ||
| CamKII-LGI1-pHluorin | This paper | Addgene Plasmid #185537 |
| CamKII-LGI1-S473L-pHluorin | This paper | Addgene Plasmid #185540 |
| CamKII-LGI1-Y433A-pHluorin | This paper | Addgene Plasmid #185541 |
| CamKII-LGI1-R474Q-pHluorin | This paper | Addgene Plasmid #185542 |
| CamKII-LGI1-T380A-pHluorin | This paper | Addgene Plasmid #185543 |
| CamKII-LGI1-E383A-pHluorin | This paper | Addgene Plasmid #185544 |
| CamKII-LGI1-C200R-pHluorin | This paper | Addgene Plasmid #185545 |
| CamKII-LGI1 (no tags) | This paper | N/A |
| vGlut-pH | Gift from Timothy A. Ryan34 | N/A |
| vGlut-mOrange-2 | Hoppa et al., 201280 | N/A |
| iGluSnFR3 | Aggarwal et al.58 | Addgene Plasmid #178330 |
| CMV-mRuby-synapsin | Gift from Timothy A. Ryan | Addgene Plasmid #187896 |
| pKanCMV-mRuby3-18aa-actin | Bajar et al.86 | Addgene plasmid #74255 |
| pLKO-synapsin-BFP | Gift from Timothy A. Ryan | Addgene Plasmid #191567 |
| pLKO-empty-mTagBFP | Gift from Timothy A. Ryan | Addgene Plasmid #191566 |
| CamKII-ADAM23-pHluorin | This paper | Addgene Plasmid #185539 |
| pGP-AAV-syn-jGCaMP8f-WPRE | Zhang et al.55 | Addgene Plasmid #162376 |
| CamKII-LGI1-pHmScarlet | This paper | Addgene Plasmid #185538 |
| CamKII-LGI1-R474Q-pHmScarlet | This paper | N/A |
| CamKII-LGI1-T380A-pHmScarlet | This paper | N/A |
| CamKII-LGI1-E383A-pHmScarlet | This paper | N/A |
| pCAGGS-SNAP25ΔC-IRES-mCherry | Ibata et al., 201943 | N/A |
| pCAGGS-SNAP29ΔC-IRES-mCherry | Ibata et al., 201943 | N/A |
| pCAGGS-Stx1AΔC-IRES-mCherry | Ibata et al., 201943 | N/A |
| pCAGGS-Stx4ΔC-IRES-mCherry | Ibata et al., 201943 | N/A |
| CMV-IgK-pHluorin-TM-mRuby | This paper | Addgene Plasmid #185546 |
| ER-pHluorin | de Juan-Sanz et al., 201736 | N/A |
| FSW-HRP-V5-LRRTM2 | Loh et al.52 | Addgene Plasmid #82537 |
| FSW-HRP-V5-LRRTM1 | Loh et al.52 | Addgene Plasmid #82536 |
| pAAV-CaMKII-Archon1-EGFP | Piatkevich et al.60 | Addgene Plasmid #108417 |
| hSyn-NPY-pHluorin | Gift from Ruud F Toonen Persoon et al. 87 | N/A |
| VAMP2-pHmScarlet | Gift from Pingyong Xu Liu et al.54 | Addgene plasmid #166890 |
| CMV-mRuby-synapsin | Gift from Timothy A. Ryan | Addgene Plasmid #187896 |
| pLKO-synapsin-BFP | Gift from Timothy A. Ryan | Addgene Plasmid #191567 |
| pLKO-empty-mTagBFP | Gift from Timothy A. Ryan | Addgene Plasmid #191566 |
| CamKII vector | Gift from Edward Boyden Chow et al. 88 | Addgene Plasmid #22217 |
| Vesicular stomatitis virus G glycoprotein | Gift from Irving WeissmanHaselmann et al. 89 | Addgene Plasmid #14888 |
| Software and algorithms | ||
| ImageJ | NIH Schneider et al. 90 | https://imagej.nih.gov/ij/ |
| GraphPad Prism 8 | GraphPad Software | https://www.graphpad.com/scientific-software/prism/ |
| R | R-project | https://www.r-project.org |
| RStudio | RStudio | https://www.rstudio.com |
| Biorender | Biorender | https://www.biorender.com/ |
| Other | ||
| ChemiDocTM Touch Imaging System | BioRad | 1708374 |
| Custom-built laser illuminated epifluorescence Microscope Axio Observer 3 |
ZEISS | N/A |
| iXon Ultra camera | Andor - Oxford Instruments | #DU-897U-CSO-#BV |
| Oasis™ UC160 Cooling System | Solid State Cooling Systems | UC160 |
| Imaging chamber | Warner Instruments | RC-21BRFS |
| Feedback loop temperature controller | Warner Instruments | TC-344C |
Resource availability
Lead contact
Further information and requests for resources and reagents may be directed to and will be fulfilled by the lead contact, Dr. Jaime de Juan-Sanz (jaime.dejuansanz@icm-institute.org).
Materials availability
Plasmids generated in this study are available at Addgene.org, as indicated in the key resources table. Any plasmid not deposited in Addgene is available upon request to the lead contact, Dr. Jaime de Juan-Sanz.
Data and code availability
-
•
Data reported in this paper will be shared by the lead contact upon request.
-
•
This paper does not report original code.
-
•
Any additional information required to reanalyze the data reported in this paper is available from the lead contact upon request.
Experimental model and subject details
Animals
Wild-type rats were of the Sprague-Dawley strain Crl:CD(SD), which are bred by Charles River Laboratories worldwide following the international genetic standard protocol (IGS). All experiments were carried out in strict accordance with the guidelines of the European Directive 2010/63/EU and the French Decree n° 2013-118 concerning the protection of animals used for scientific purposes. Experiments were approved by the local ethics committee Comité d’éthique N°5 Darwin. Rats were maintained in a temperature-controlled room with a light/dark cycle alternating 12 h each and ad libidum access to food and water.
Primary co-culture of postnatal neuronal and astrocytes
All experiments were performed in primary co-cultures of hippocampal neuronal and astrocytes, except for proximity biotinylation experiments. P0 to P2 rats of mixed-gender were dissected to isolate hippocampal CA1-CA3 neurons. Neurons were plated on poly-ornithine-coated coverslips, transfected 5–7 days after plating, and imaged 14–21 days after plating. Transfection was performed using the calcium phosphate method34 using equal amounts of DNA when co-transfecting two different plasmids. This method yields a very sparse transfection in primary neuronal cultures, with a 0.5–1% efficiency that allows to study fluorescence changes in presynaptic arborizations of single neurons during field stimulation. Neurons were maintained in culture media composed MEM (Thermo Fisher Scientific), of 20 mM Glucose, 0.1 mg/mL transferrin (Sigma), 1% Glutamax (Thermo Fisher Scientific), 24 μg/mL insulin (Sigma), 5% FBS (Thermo Fisher Scientific), 2% N-21 (Bio-techne) and 4μM cytosine β-d-arabinofuranoside (Millipore). Cultures were incubated at 37°C in a 95% air/5% CO2 humidified incubator for 14–21 days prior to use.
Primary culture of embryonic cortical neurons for synaptic cleft biotinylation
Pregnant wild-type Sprague Dawley Crl:CD(SD) rats were purchased from Charles River Laboratories. After euthanasia using CO2 (carried out by the animal facility from Paris Brain Institute), embryos were sacrificed at embryonic day 18 (E18). Dissected rat embryo cortical tissue was digested with papain (Worthington Biochemical, LK003178) and DNase I (Roche, 10104159001) and 3.5 million cortical neurons were plated per 10 cm dish, which were previously coated through a pre-incubation overnight at 37°C with 0.1 mg/mL poly-D-lysine (Sigma, P2636). Neurons were cultured at 37°C under 5% CO2 in plating medium composed by a 1:1 volume ratio of growth medium A and growth medium B. Growth medium A is composed of: MEM (Sigma) with L-glutamine (Sigma) supplemented with 10% (v/v) fetal bovine serum (GIBCO) and 2% (v/v) N21 (Life Technologies). Growth medium B is composed of: Neurobasal medium (Life Technologies) supplemented with 2% (v/v) N-21 (Bio-techne) and 1% (v/v) GlutaMAX (Sigma). At 5 days in vitro, half of the culture medium was replaced with fresh BrainPhysTM Neuronal Medium supplemented with 2% (v/v) SM1 (STEMCELLTM Technologies, 05792) and 12.5 mM D-(+)-Glucose (Sigma, G8270) in addition to 10 μM 5′-fluoro-2′-deoxyuridine (FUDR, Fisher Scientific, 10144760), an antimitotic drug less toxic than the commonly used Cytosine Arabinofuranoside (Ara-C). While Ara-C does not impact the health of astrocyte-neuron co-cultures used for imaging, we found that it appeared to be excessively toxic for pure neuronal cultures. In contrast, FUDR provided pure neuronal cultures that could be maintained without apparent toxicity for more than three weeks and thus became our preferred antimitotic drug for pure neuronal cultures. This medium replacement was repeated every 4–5 days until the day of the experiment.
Method details
Replication: Not applicable.
Strategy for randomization and/or stratification: Not applicable.
Blinding at any stage of the study: Analysis was not blinded to genotype.
Sample-size estimation and statistical method of computation: Not applicable.
Gene constructs
LGI1-pHluorin was designed to express wild type rat LGI1 followed by a short flexible linker (SGSTSGGSGGTG) and pHluorin. This construct was optimized in silico for rat protein expression, synthesized in vitro (Invitrogen GeneArt Gene Synthesis) and cloned into the BamHI and EcoRI sites of the CaMKII promoter vector for exclusive expression in excitatory neurons.38 CamKII vector was a gift from Edward Boyden (Addgene plasmid #22217).88 LGI1 E383A mutant was generated on this vector using site-directed mutagenesis (Q5 Site-Directed Mutagenesis Kit, New England Biolabs E0552) following manufacturer instructions using the primers indicated in Table S2. LGI1 mutants S473L, Y433A, R474Q, C200R and T380A in this vector were purchased at Eurofins (see Table S2 for primers used). LGI1-pHmScarlet was created by replacing pHluorin with pHmScarlet using Gibson Assembly (NEBuilder HiFi DNA Assembly Master Mix, New England Biolabs). Insert containing pHmScarlet was obtained by PCR amplification from VAMP2-pHmScarlet,54 a gift from Pingyong Xu (Addgene plasmid # 166890). A plasmid to express mRuby-synapsin was generated by removing GFP from GFP-synapsin91 using restriction sites AgeI and BglII, and substituting it in frame with mRuby obtained from pKanCMV-mRuby3-18aa-actin, which was a gift from Michael Lin (Addgene plasmid # 74255). This plasmid was cloned in the laboratory of Timothy A. Ryan (Addgene plasmid # 187896). ADAM23-pHluorin was designed to express the signal peptide of wild type rat ADAM23 (first 56 amino acids) followed by pHluorin, a short flexible linker (SGSTSGGSGGTG) and the rest of ADAM23 (amino acids 56–828). This construct was optimized in silico for rat protein expression, synthesized in vitro (Invitrogen GeneArt Gene Synthesis) and cloned into the BamHI and EcoRI sites of the CaMKII promoter vector, which was a gift from Edward Boyden (Addgene plasmid #22217).88 These constructs have been deposited in addgene, where construct maps can be found easily.
Live imaging of neurons
Primary hippocampal neurons were transfected using calcium phosphate at DIV7 as previously described34 and were imaged from DIV14 to DIV21. Imaging experiments were performed using a custom-built laser illuminated epifluorescence microscope (Zeiss Axio Observer 3) coupled to an Andor iXon Ultra camera (model #DU-897U-CSO-#BV), whose chip temperature is cooled down to −95°C using the Oasis UC160 Cooling System to reduce noise in the measurements. Illumination using fiber-coupled lasers of wavelengths 488 (Coherent OBIS 488nm LX 30mW) and 561 (Coherent OBIS 561nm LS 80mW) was combined through using the Coherent Galaxy Beam Combiner, and laser illumination was controlled using a custom Arduino-based circuit coupling imaging and illumination. Neuron-astrocyte co-cultures were grown in coverslips (D = 0.17mm, Warner instruments), mounted on an RC-21BRFS (Warner Instruments) imaging chamber for field stimulation and imaged through a 40x Zeiss oil objective Plan-Neofluar with an NA of 1.30 (WD = 0.21mm). Unless otherwise noted, imaging frequency was 2Hz. Different imaging frequencies are used in certain experiments: 100Hz for single action potential cytosolic jGCaMP8f, 350Hz for single action potential iGluSnFR3 and 2000Hz for single action potential waveform using Archon1. For voltage imaging, light was collected through the objective using a cropped sensor mode (10 MHz readout, 500 ns pixel shift speed) to achieve 2 kHz frame rate imaging (exposure time of 485 μs) using an intermediate image plane mask (Optomask; Cairn Research) to prevent light exposure of non relevant pixels.62 To obtain sufficient signal to noise, each neuron AP waveform data comes from the average of 50 independent measurements taken at 5Hz. Temperature of all experiments was clamped at 36.5°C, except for voltage imaging, where it was clamped at 34°C. Temperature was kept constant by heating the stimulation chamber through a heated platform (PH-2, warner instruments) together with the use of an in-line solution heater (SHM-6, warner instruments), through which solutions were flowed at 0.35 mL/min. Temperature was kept constant using a feedback loop temperature controller (TC-344C, warner instruments).
Imaging was performed in continuously flowing Tyrode’s solution containing (in mM) 119 NaCl, 2.5 KCl, 1.2 CaCl2, 2.8 MgCl2, 20 glucose, 10 μM 6-cyano-7-nitroquinoxaline-2,3-dione (CNQX) and 50 μM μM D-(−)-2-Amino-5-phosphonopentanoic acid (AP5), buffered to pH 7.4 at 37°C using 25 mM HEPES. NH4Cl solution for pHluorin measurements had a similar composition as Tyrode’s buffer except it contained (in mM): 50 NH4Cl and 69 NaCl for a pH of 7.4 at 37°C. The solution for surface acid quenching of pHluorin is identical to the Tyrode’s solution but was buffered using MES instead of HEPES and was set to pH 5.5 (at 37°C). Cells were flowed with MES and NH4Cl at faster speeds of 0.8 mL/min for a quick pH change.
For experiments in Figure 2, bafilomycin (Cayman Chemical Company) was diluted in Tyrode’s to a final concentration of 500nM and it was continuously flowed on neurons expressing either vGlut-pHluorin or LGI1-pHluorin for 1000 s, acquiring images every 0.5 s. In experiments in which vGlut-pHluorin or LGI1-pHluorin transfected neurons were treated with EGTA-AM, we first acquired the response to stimulation, then neurons were incubated with 2mM EGTA-AM for 10 min, and then we acquired the response to stimulation in the same region. Chronic incubation with TTX (Tocris) was performed by adding 1 μM final concentration of TTX in the culture media 5–6 days prior imaging. Next, TTX was washed by flowing Tyrode’s solution during 10 min and optophysiological recordings using jGCaMP8f or iGluSnFR3 were performed.
pH, surface fraction and total pool measurements using pHluorin constructs
Intraluminal organelle pH in vGlut-, ADAM23-and LGI1-pHluorin-containing vesicles was calculated leveraging the known properties of pHluorin response to pH (pKa 7.1), as previously described.34 The pH estimates obtained from LGI1-pH secretion-defective mutants C200R and E383A in axons was not reliable as the signal-to-noise change in fluorescence during NH4Cl application was very low due to the low expression in the axon of these mutants. For measuring surface fraction of pH-tagged constructs, axons of neurons expressing vGlut-, ADAM23-and LGI1-pHluorin constructs were perfused briefly with an acidic solution at pH 5.5 buffered with MES (2-(N-morpholino)ethanesulfonic acid) for acid quench of pHluorin expressed at the neuronal surface followed by a NH4Cl solution at pH 7.4 for alkalization of vesicular pH, which reveals the total pool of pHluorin-tagged molecules. For these fast perfusions, flow rate was ∼0.8 mL/min. Surface fraction of vGlut-pH, LGI1-pH and of LGI1 mutants-pH were determined before and after electrical stimulation using MES/NH4Cl measurements as previously described.34 Cells were flowed sequentially with MES and NH4Cl solutions and then washed for 10min in Tyrode’s solution. Next, neurons were stimulated using field stimulation as indicated in the text (1000AP 50Hz or 3000AP 50Hz) and 5 min later surface fraction was measured again using MES/NH4Cl. To measure the total pool of LGI1 or LGI1 mutants before and after stimulation, a similar approach was used. Change in fluorescence by NH4Cl solution reveals the total pool present, and thus ΔF in the presence of NH4Cl pH 7.4 was acquired before and after electrical stimulation. All experiments were acquired with the same laser power and exposure times to be comparable.
Estimates of LGI1-pH molecules exocytosed per univesicular event using single EGFP imaging
Purified EGFP (Abcam) was diluted in PBS to a final concentration of 1 μg/mL and placed in a coverslip identical to those used for live neuron imaging. After droplets dried, we mounted 3 independent coverslips using ProLong (Thermo Fisher Scientific) and imaged 16 randomly selected fields at room temperature to quantify fluorescence corresponding to each EGFP dot identified, obtaining 1727 separate EGFP measurements. We fitted this population to a single Gaussian distribution that presented an mean value of 535 a.u. (R-squared = 0.95), which we attribute to the fluorescence of a single EGFP molecule in our imaging conditions. We next imaged univesicular exocytosis of LGI1-pH during 200AP stimulation evoked at 50Hz using the same exact imaging conditions and analyzed 374 single-bouton exocytosis events obtained from 8 neurons. Changes in arbitrary units of fluorescence during exocytosis presented a median of 3015 a.u. (25% percentile = 1910; 75% percentile = 4594), which allows to conclude that approximately 6 LGI1-pH molecules are contained on average in a single LGI1 vesicle.
Identification of univesicular and multivesicular exocytosis events
The robustness of LGI1-pH responses allows studying single bouton events with a sufficient signal to noise that in a high fraction of the cases allows one to attribute fluorescence changes to univesicular or multivesicular exocytosis events. An exocytosis event is considered for our analyses if it fulfills the following criteria: 1) it presents a stable baseline during at least 3 s before the fluorescence increase and 2) it presents an increase of ΔF/F at least 6 times the standard deviation of that baseline before exocytosis.
To define whether events arise from the exocytosis of one or multiple vesicles, we first established the criteria for defining univesicular release. Univesicular events present a sharp increase in fluorescence in the sub second timescale, as exocytosis signals derived from pHluorins arise from the pH transition from ∼6.1 to 7.4 and the subsequent deprotonation of GFP, both of which occur in the millisecond timescale.92 We thus consider an exocytosis event to be univesicular when the complete increase in fluorescence from baseline to maximum occurs in 1 s or less. This value is defined by the time resolution of our imaging frequency (2Hz). Figure S2B shows example responses.
Events were categorized as dual exocytosis events when during stimulation two complete increases in fluorescence from baseline to maximum occurred each in 1 s or less (see Figure S2C). Comparison of both events from the same presynaptic site revealed that on average fluorescence changes were identical in both the first and second events (Figures S4D, and S4E). This indicates that our selection criteria for considering an exocytosis event as univesicular is accurate, as it would be very unlikely that an identical number of multiple vesicles are being exocytosed subsequently in the first and second events. Lastly, multivesicular events are those in which during stimulation the fluorescence increases more than 6 times the value of the standard deviation of the baseline fluorescence but cannot be categorized as having only one or two exocytosis events following the criteria outlined above.
Identification of secretion-like responses in LGI1-pH translocation events
While LGI1-pH did not present dynamics resembling canonical secretion, in some cases translocation events presented mixed kinetics with partial secretion-like decreases in fluorescence (see Figure S3C). We identified these events in responding boutons after stimulation using the following criteria: 1) they presented a decrease in fluorescence of at least 3 times the standard deviation of the baseline before the event, 2) the decrease occurred in 1 s or less and 3) they presented a stable baseline for 2 s after the event (which was defined by excluding events whose fluorescence changed more than 10% after the sharp decrease). Possible events matching this criteria were initially identified manually to later quantify whether they fulfill the criteria stated above.
Delay to undergo exocytosis during electrical stimulation
To quantify the delay to respond during stimulation in individual boutons of neurons expressing vGlut-pH, LGI1-pH, NPY-pH or ADAM23-pH, we analyzed ΔF/F traces of individual boutons in each condition. We leveraged the sharp increase in fluorescence of responding boutons during stimulation to identify the time taken for responding since the stimulation began. To do so, we set a threshold for identifying a response: fluorescence of a responding bouton had to increase at least 6 times over the standard deviation of the baseline, which was calculated using the 20 time points before stimulation. To avoid including non-relevant fluctuations in fluorescence, boutons that did not maintain an increase in fluorescence of 6 times de standard deviation of the baseline during at least 1 s after the initial increase were excluded. Similarly, increases in fluorescence that were not larger than 6 times the standard deviation of the baseline were not part of this analysis. Individual asynchronous universicular exocytosis events of LGI1-pH, NPY-pH and ADAM23-pH, identified using the criterion explained above, were aligned to start rising at the same time to obtain average traces in Figures 3A and 3B, 3L, 5D.
Quantification of endogenous surface LGI1 levels in the synaptic cleft by proximity biotinylation
Isolation of synaptic cleft proteins was performed as previously described in detail,52 with small modifications. Two 10 cm dishes were plated with 3.5 million rat primary embryonic cortical neurons per experimental condition. At day 15 DIV, dishes were transduced with lentivirus expressing FSW-HRP-V5-LRRTM1 and FSW-HRP-V5-LRRTM2 constructs, using a total of 2 x 10⁸ VP/ml for transduction per 10 cm culture dish. After 4 days, live cell biotinylation experiments were performed at DIV19 as described below. Lentivirus were produced at the iVector facility at the Paris Brain Institute in BSL2 facilities transfecting HEK293T cells with constructs of interest together with 3rd generation packaging, transfer and envelope plasmids, using the vesicular stomatitis virus G glycoprotein (VSVG) as envelope protein.89 Transient transfection of HEK293T was done using lipofectamine 2000 (Thermo Fisher Scientific) in a medium containing chloroquine (Thermo Fisher Scientific). The medium was replaced after 6 h and the supernatant was collected after 36 h. The supernatant was treated with DNAseI (Roche, 10104159001) and then ultracentrifugation was carried out at 22 000 rpm (rotor SW28, Beckman-Coulter) for 90 min. The resulting pellet was resuspended in 0.1M PBS, aliquoted and frozen at −80°C until use. Lentiviral productions presented titers ranging 9.9–19.7 x 10⁸ viral particles (VP) per μL, measured by Elisa using the p24 ZeptoMetrix kit (Sigma-Merck).
For evaluating the effect of activity in synaptic surface abundance of LGI1, chronic incubation with TTX (Tocris) was performed by adding 1 μM final concentration of TTX in the culture media 5 days prior to the experiment. Next, control and TTX-treated DIV19 neurons were exposed during 60 s to H2O2 and BxxP, an impermeant variant of biotin-phenol that contains a long and polar polyamide linker (ApexBio Technology), which allows selective biotinylation of proteins localized at the synaptic surface, as previously described.52 After washing and scraping the neurons, 150 μg of lysate per condition were incubated overnight with 40μL of PierceTM Streptavidin Magnetic Beads slurry (Thermo Fisher Scientific 88817) at 4°C with gentle rotation. The next day, bead were washed as described before52 (2 × 1 mL RIPA lysis buffer, 1 × 1 mL of 1M KCl, 1x 1 mL of 0.1 M Na2CO3, 1 × 1 mL of 2 M urea in 10 mM Tris-HCl (pH 8.0), and again with 2 × 1 mL RIPA lysis buffer). Finally, to elute biotinylated proteins, beads were boiled for 10 min in 25 μL of 3x protein loading buffer supplemented with 20 mM DTT and 2 mM Biotin (Sigma, B4501). The streptavidin eluate was collected and run on an 10% SDS-PAGE gel and 0.22 μm nitrocellulose membranes were immunoblotted and developed as described below.
For the western blotting visualization of whole lysates, these were combined with 4x SDS protein loading buffer supplemented with 40 mM dithiothreitol DTT (Sigma, D9779), run on an 8% SDS-PAGE gel and transferred to a 0.22 μm nitrocellulose membrane (AmershamTM Protran, G10600080). For both western blots of whole lysates and biotinylated proteins, membranes were blocked with 10% Milk (Merck Milipore, 70166) in TBS-T (0.2% Tween 20 in Tris-buffered saline) at room temperature for 1 h, then incubated with primary antibodies at 4°C overnight in gentle agitation. Anti-Lgi1/EPT (abcam 30868, 1:500 dilution), anti-GluA1 (UC Davis/NIH NeuroMab Facility, 75–327, 1:500 dilution) anti-V5 (Invitrogen R96025, 1:2000 dilution) and anti-Beta Actin (Thermo Fisher Scientific PA5-85271, 1:5000 dilution) antibodies were diluted in 10% milk. The following day, membranes were washed with 1x TBS-T four times for 10 min each time and probed with Goat Anti-Rabbit IgG (H + L)-HRP Conjugate or Goat Anti-Mouse IgG (H + L)-HRP secondary antibodies (BioRad 1706515 and 1706516, 1:5000 dilution in 10% milk), then washed with 1x TBS-T four times for 10 min each time and finally developed with Clarity or Clarity Max ECL Western Blotting Substrates (BioRad 1705060 and 1705062) using for imaging one ChemiDocTM Touch Imaging System (BioRad laboratories). For checking or to visualize the global biotinylation reaction, the membrane was blocked with 3% w/v BSA in TBS-T (0.2% Tween 20 in Tris-buffered saline) at 4°C overnight and incubated with Pierce High Sensitivity Streptavidin-HRP (Thermo Fisher Scientific 21130, 1:5000 dilution in 3% w/v BSA in TBS-T) at room temperature for 1 h, then washed with TBS-T 3–4 times for 10 min each time and developed as described above. Uncropped blots corresponding to the blots shown in Figure 4 can be found in Figure S10.
Polyclonal LGI1 auto-antibodies from patients with limbic encephalitis: Preparation and use
LGI1 IgG was purified from plasma exchange material of 3 patients suffering from LGI1 encephalitis, obtaining enriched samples with high titer (1:100) anti-LGI1 antibodies. These three samples were mixed as described previously,20 and adjusted to a final concentration of 5 mg/mL in 0.9% NaCl for long term storage. Control IgGs, with a final concentration of 5 mg/mL, were obtained from a single donor who was clinically confirmed to not present any CNS disorder and who did not have detectable abnormal antibodies, as done previously.20,93 All human subjects provided informed consent for use of plasma exchange material and use of human material was approved by the local ethics committee of Jena University Hospital (license # 2019-1415-Material).
Purified antibodies were added to primary rat hippocampal cultures at final concentrations of 100 μg/mL seven days before recordings. To avoid excessive usage of antibodies, a 10mm cloning cylinder was placed on top of the coverslip using vacuum grease, allowing to treat neurons contained inside the cylinder in a reduced volume of 120μL. One day before the experiment, half of the medium (60 μL) was removed from the media contained in the cylinder and purified polyclonal antibodies were added to the remaining medium (final concentration 100 μg/mL). Purified control antibodies from donors without LGI1-encephalitis were applied identically to the respective autoantibody groups. At the moment of the experiment, neurons were washed in Tyrode’s buffer and imaged as described above.
Quantification and statistical analysis
Image analysis and statistics
We cultured and transfected primary hippocampal neurons in 30–40 independent coverslips per week. Each experiment was replicated in several independent imaging sessions at different days, as indicated in Table S1. Image analysis was performed with the ImageJ plugin Time Series Analyzer V3 where typically 150–250 regions of interest (ROIs) corresponding to synaptic boutons or 10–150 ROIs for responding boutons were selected and the fluorescence was measured over time. Statistical analysis was performed with GraphPad Prism v8 for Windows. Statistic tests are indicated in Table S1. Mann–Whitney U test was used to determine the significance of the difference between two unpaired conditions without assuming normal distributions. Kruskal-Wallis test was used to determine whether there are any statistically significant differences between the medians of three or more independent groups. If a significant result from the Kruskal-Wallis test was obtained we used Dunn’s multiple comparison test to identify which specific groups differ from each other. Wilcoxon matched-pairs test was performed for our two paired datasets without assuming normal distributions. If datasets to be compared followed a normal distribution, which was evaluated by performing an Anderson-Darling normality test, we used Student's t test to compare two populations and one-way ANOVA with Dunnett’s multiple comparisons test for multiple populations. Throughout the text p < 0.05 was considered significantly different and denoted with a single asterisk, whereas p < 0.01, p < 0.001 and p < 0.0001 are denoted with two, three, and four asterisks, respectively. In experiments shown in Figures 3E, 3G, 4B, 4D and 5E we analyze paired comparisons of independent experiments to dissect whether individually each condition presents a significant change, instead of comparing the quantitative extent to which delta changes are different numerically. The rationale for this is that absolute numerical comparisons can be misleading if one needs to test relative changes in separate conditions that do not share the same underlying physiology, as is the case of different types of vesicles (Figure 4), or different mutants (Figure 3; Figure 5). Throughout the text, when showing violin plots, quartiles are indicated by small dotted lines while the median is represented by a bold dotted line. When data are averaged, error shown represents SEM unless otherwise noted.
Inclusion and exclusion criteria of any data or subjects
Glutamate release and AP-driven presynaptic Ca2+ signals in response to electrical activity (ΔF) were normalized to the resting fluorescence (F0). To avoid overestimating ΔF/F0 in responding neurons with low F0 values, we set an arbitrary threshold such that F0/background >1.25 to be included for further analysis.36 The rationale for using such a threshold is as follows: a neuron expressing a fluorescent sensor must present enough signal at baseline fluorescence (F0) over background fluorescence (Fbackground) for accurate quantification of ΔF/F0 responses. If F0 and Fbackground are too similar, as the difference between F0 and Fbackground approaches 0, the quotient of ΔF divided by (F0-Fbackground) approaches infinity and thus ΔF/F0 estimates are overestimated in a non-linear fashion. This can be curbed partially by excluding neurons that are not at least 25% brighter than the background. This threshold did not exclude any iGluSnFR3 or jGCaMP8f responses obtained from single presynaptic arborizations. However, when applied to single-bouton responses, 51 out 915 iGluSnFR3 responses were excluded (5.5%), while no response was excluded for jGCaMP8f experiments. For the experiments quantifying LGI1-pHluorin and ADAM23-pHluorin changes during prolonged stimulation (1000AP 50Hz, 3000AP 50Hz) we occasionally observed a global decrease in fluorescence of the entire field of view, including the background. Thus, we set a threshold to exclude experiments without stable background conditions. Background regions were measured over time and experiments that experimented a change in background higher than 30% were excluded. Thus, for 1000AP 50Hz stimulation recordings, 3 out of 21 neurons were excluded and for 3000AP 50Hz stimulation recordings, 2 neurons out of 10 were excluded. For experiments in which we analyzed single bouton LGI1-pH, NPY-pH and ADAM23-pH exocytosis responses, we analyzed responses whose change in ΔF/F was at least 6 times the standard deviation of the baseline before exocytosis.
Acknowledgments
We would like to thank all members of the de Juan-Sanz laboratory for insightful discussions and comments. This work was made possible by the Paris Brain Institute Diane Barriere Chair in Synaptic Bioenergetics awarded to J.d.J.-S. Our funding sources are an ERC Starting Grant SynaptoEnergy (European Research Council, ERC-StG-852873), 2019 ATIP-Avenir Grant (CNRS, Inserm), and a Big Brain Theory Grant (ICM) awarded to J.d.J.-S. C.P.-C. is the recipient of a postdoctoral fellowship from the Fundacion Martin Escudero. J.d.J.-S. is a permanent CNRS researcher and a FENS-Kavli Scholar. This work was supported by an ERC Consolidator Grant (ERC-CoG-865634) to S.H. and the German Research Foundation (FOR3004–SYNABS; HA6386/10-2 to S.H. and GE2519/8-2 to C.G.). M.B.H. and A.S.A. are grateful for the generous support from NIH NINDS 5R01NS112365 (to M.B.H.) the NSF (CAREER 1750199) and the Neukom Institute (Dartmouth).
Author contributions
U.C. and L.C.-R. contributed equally to this work. Conceptualization, U.C., L.C.-R., and J.d.J.-S.; methodology, U.C., L.C.-R., C.P.-C., and J.d.J.-S.; investigation, U.C., L.C.-R., C.P.-C., A.S.A., M.B.H., and J.d.J.-S.; funding acquisition, project administration, and supervision, J.d.J.-S.; providing essential materials, A.A., K.P., K.I., M.Y., C.G., S.H., and A.R.-J.; writing – original draft, U.C., L.C.-R., and J.d.J.-S.; writing – review & editing, U.C., L.C.-R., C.P.-C., A.S.A., M.B.H., and J.d.J.-S.
Declaration of interests
The authors declare no competing interests.
Published: May 2, 2024
Footnotes
Supplemental information can be found online at https://doi.org/10.1016/j.celrep.2024.114186.
Supplemental information
References
- 1.Contractor A., Rogers C., Maron C., Henkemeyer M., Swanson G.T., Heinemann S.F. Trans-Synaptic Eph Receptor-Ephrin Signaling in Hippocampal Mossy Fiber LTP. Science. 2002;296:1864–1869. doi: 10.1126/SCIENCE.1069081. [DOI] [PubMed] [Google Scholar]
- 2.Fossati M., Assendorp N., Gemin O., Colasse S., Dingli F., Arras G., Loew D., Charrier C. Trans-Synaptic Signaling through the Glutamate Receptor Delta-1 Mediates Inhibitory Synapse Formation in Cortical Pyramidal Neurons. Neuron. 2019;104:1081–1094.e7. doi: 10.1016/J.NEURON.2019.09.027. [DOI] [PMC free article] [PubMed] [Google Scholar]
- 3.Fossati M., Charrier C. Trans-synaptic interactions of ionotropic glutamate receptors. Curr. Opin. Neurobiol. 2021;66:85–92. doi: 10.1016/J.CONB.2020.09.001. [DOI] [PubMed] [Google Scholar]
- 4.Fukata Y., Adesnik H., Iwanaga T., Bredt D.S., Nicoll R.A., Fukata M. Epilepsy-related ligand/receptor complex LGI1 and ADAM22 regulate synaptic transmission. Science. 2006;313:1792–1795. doi: 10.1126/SCIENCE.1129947/SUPPL_FILE/FUKATA_SOM.PDF. [DOI] [PubMed] [Google Scholar]
- 5.Gorlewicz A., Kaczmarek L. Pathophysiology of trans-synaptic adhesion molecules: Implications for epilepsy. Front. Cell Dev. Biol. 2018;6:119. doi: 10.3389/FCELL.2018.00119/BIBTEX. [DOI] [PMC free article] [PubMed] [Google Scholar]
- 6.Takahashi H., Katayama K.I., Sohya K., Miyamoto H., Prasad T., Matsumoto Y., Ota M., Yasuda H., Tsumoto T., Aruga J., Craig A.M. Selective control of inhibitory synapse development by Slitrk3-PTPδ trans-synaptic interaction. Nat. Neurosci. 2012;15:389–S2. doi: 10.1038/nn.3040. [DOI] [PMC free article] [PubMed] [Google Scholar]
- 7.Uemura T., Lee S.J., Yasumura M., Takeuchi T., Yoshida T., Ra M., Taguchi R., Sakimura K., Mishina M. Trans-Synaptic Interaction of GluRδ2 and Neurexin through Cbln1 Mediates Synapse Formation in the Cerebellum. Cell. 2010;141:1068–1079. doi: 10.1016/J.CELL.2010.04.035. [DOI] [PubMed] [Google Scholar]
- 8.Woo J., Kwon S.K., Choi S., Kim S., Lee J.R., Dunah A.W., Sheng M., Kim E. Trans-synaptic adhesion between NGL-3 and LAR regulates the formation of excitatory synapses. Nat. Neurosci. 2009;12:428–437. doi: 10.1038/nn.2279. [DOI] [PubMed] [Google Scholar]
- 9.Tang A.H., Chen H., Li T.P., Metzbower S.R., MacGillavry H.D., Blanpied T.A. A transsynaptic nanocolumn aligns neurotransmitter release to receptors. Nature. 2016;536:210–214. doi: 10.1038/NATURE19058. [DOI] [PMC free article] [PubMed] [Google Scholar]
- 10.Kalachikov S., Evgrafov O., Ross B., Winawer M., Barker-Cummings C., Martinelli Boneschi F., Choi C., Morozov P., Das K., Teplitskaya E., et al. Mutations in LGI1 cause autosomal-dominant partial epilepsy with auditory features. Nat. Genet. 2002;30:335–341. doi: 10.1038/ng832. [DOI] [PMC free article] [PubMed] [Google Scholar]
- 11.Fels E., Muñiz-Castrillo S., Vogrig A., Joubert B., Honnorat J., Pascual O. Role of LGI1 protein in synaptic transmission: From physiology to pathology. Neurobiol. Dis. 2021;160 doi: 10.1016/J.NBD.2021.105537. [DOI] [PubMed] [Google Scholar]
- 12.Kornau H.C., Kreye J., Stumpf A., Fukata Y., Parthier D., Sammons R.P., Imbrosci B., Kurpjuweit S., Kowski A.B., Fukata M., et al. Human Cerebrospinal Fluid Monoclonal LGI1 Autoantibodies Increase Neuronal Excitability. Ann. Neurol. 2020;87:405–418. doi: 10.1002/ANA.25666. [DOI] [PubMed] [Google Scholar]
- 13.Lai M., Huijbers M.G.M., Lancaster E., Graus F., Bataller L., Balice-Gordon R., Cowell J.K., Dalmau J. Investigation of LGI1 as the antigen in limbic encephalitis previously attributed to potassium channels: a case series. Lancet Neurol. 2010;9:776–785. doi: 10.1016/S1474-4422(10)70137-X. [DOI] [PMC free article] [PubMed] [Google Scholar]
- 14.Ohkawa T., Fukata Y., Yamasaki M., Miyazaki T., Yokoi N., Takashima H., Watanabe M., Watanabe O., Fukata M. Autoantibodies to Epilepsy-Related LGI1 in Limbic Encephalitis Neutralize LGI1-ADAM22 Interaction and Reduce Synaptic AMPA Receptors. J. Neurosci. 2013;33:18161–18174. doi: 10.1523/JNEUROSCI.3506-13.2013. [DOI] [PMC free article] [PubMed] [Google Scholar]
- 15.Boillot M., Huneau C., Marsan E., Lehongre K., Navarro V., Ishida S., Dufresnois B., Ozkaynak E., Garrigue J., Miles R., et al. Glutamatergic neuron-targeted loss of LGI1 epilepsy gene results in seizures. Brain. 2014;137:2984–2996. doi: 10.1093/BRAIN/AWU259. [DOI] [PMC free article] [PubMed] [Google Scholar]
- 16.Yamagata A., Miyazaki Y., Yokoi N., Shigematsu H., Sato Y., Goto-Ito S., Maeda A., Goto T., Sanbo M., Hirabayashi M., et al. Structural basis of epilepsy-related ligand-receptor complex LGI1-ADAM22. Nat. Commun. 2018;9 doi: 10.1038/S41467-018-03947-W. [DOI] [PMC free article] [PubMed] [Google Scholar]
- 17.Extrémet J., El Far O., Ankri N., Irani S.R., Debanne D., Russier M. An Epitope-Specific LGI1-Autoantibody Enhances Neuronal Excitability by Modulating Kv1.1 Channel. Cells. 2022;11:2713. doi: 10.3390/cells11172713. [DOI] [PMC free article] [PubMed] [Google Scholar]
- 18.Petit-Pedrol M., Sell J., Planagumà J., Mannara F., Radosevic M., Haselmann H., Ceanga M., Sabater L., Spatola M., Soto D., et al. LGI1 antibodies alter Kv1.1 and AMPA receptors changing synaptic excitability, plasticity and memory. Brain. 2018;141:3144–3159. doi: 10.1093/BRAIN/AWY253. [DOI] [PMC free article] [PubMed] [Google Scholar]
- 19.Seagar M., Russier M., Caillard O., Maulet Y., Fronzaroli-Molinieres L., De San Feliciano M., Boumedine-Guignon N., Rodriguez L., Zbili M., Usseglio F., et al. LGI1 tunes intrinsic excitability by regulating the density of axonal Kv1 channels. Proc. Natl. Acad. Sci. USA. 2017;114:7719–7724. doi: 10.1073/PNAS.1618656114/-/DCSUPPLEMENTAL. [DOI] [PMC free article] [PubMed] [Google Scholar]
- 20.Ritzau-Jost A., Gsell F., Sell J., Sachs S., Montanaro J., Kirmann T., Maaß S., Irani S.R., Werner C., Geis C., et al. LGI1 autoantibodies enhance synaptic transmission by presynaptic Kv1 loss and increased action potential broadening. bioRxiv. 2023 doi: 10.1101/2023.10.04.560631. Preprint at. [DOI] [Google Scholar]
- 21.Lugarà E., Kaushik R., Leite M., Chabrol E., Dityatev A., Lignani G., Walker M.C. LGI1 downregulation increases neuronal circuit excitability. Epilepsia. 2020;61:2836–2846. doi: 10.1111/EPI.16736. [DOI] [PubMed] [Google Scholar]
- 22.Fukata Y., Chen X., Chiken S., Hirano Y., Yamagata A., Inahashi H., Sanbo M., Sano H., Goto T., Hirabayashi M., et al. LGI1–ADAM22–MAGUK configures transsynaptic nanoalignment for synaptic transmission and epilepsy prevention. Proceedings of the National Academy of Sciences of the United States of America. 2021;118 doi: 10.1073/PNAS.2022580118/-/DCSUPPLEMENTAL. [DOI] [PMC free article] [PubMed] [Google Scholar]
- 23.Fukata Y., Lovero K.L., Iwanaga T., Watanabe A., Yokoi N., Tabuchi K., Shigemoto R., Nicoll R.A., Fukata M. Disruption of LGI1–linked synaptic complex causes abnormal synaptic transmission and epilepsy. Proc. Natl. Acad. Sci. USA. 2010;107:3799–3804. doi: 10.1073/PNAS.0914537107. [DOI] [PMC free article] [PubMed] [Google Scholar]
- 24.Yokoi N., Fukata Y., Okatsu K., Yamagata A., Liu Y., Sanbo M., Miyazaki Y., Goto T., Abe M., Kassai H., et al. 14-3-3 proteins stabilize LGI1-ADAM22 levels to regulate seizure thresholds in mice. Cell Rep. 2021;37 doi: 10.1016/J.CELREP.2021.110107. [DOI] [PubMed] [Google Scholar]
- 25.Baulac S., Ishida S., Mashimo T., Boillot M., Fumoto N., Kuwamura M., Ohno Y., Takizawa A., Aoto T., Ueda M., et al. A rat model for LGI1-related epilepsies. Hum. Mol. Genet. 2012;21:3546–3557. doi: 10.1093/HMG/DDS184. [DOI] [PubMed] [Google Scholar]
- 26.Ramberger M., Berretta A., Tan J.M.M., Sun B., Michael S., Yeo T., Theorell J., Bashford-Rogers R., Paneva S., O’Dowd V., et al. Distinctive binding properties of human monoclonal LGI1 autoantibodies determine pathogenic mechanisms. Brain. 2020;143:1731–1745. doi: 10.1093/BRAIN/AWAA104. [DOI] [PMC free article] [PubMed] [Google Scholar]
- 27.Yokoi N., Fukata Y., Kase D., Miyazaki T., Jaegle M., Ohkawa T., Takahashi N., Iwanari H., Mochizuki Y., Hamakubo T., et al. Chemical corrector treatment ameliorates increased seizure susceptibility in a mouse model of familial epilepsy. Nat. Med. 2014;21:19–26. doi: 10.1038/nm.3759. [DOI] [PubMed] [Google Scholar]
- 28.Senechal K.R., Thaller C., Noebels J.L. ADPEAF mutations reduce levels of secreted LGI1, a putative tumor suppressor protein linked to epilepsy. Hum. Mol. Genet. 2005;14:1613–1620. doi: 10.1093/HMG/DDI169. [DOI] [PubMed] [Google Scholar]
- 29.Sirerol-Piquer M.S., Ayerdi-Izquierdo A., Morante-Redolat J.M., Herranz-Pérez V., Favell K., Barker P.A., Pérez-Tur J. The epilepsy gene LGI1 encodes a secreted glycoprotein that binds to the cell surface. Hum. Mol. Genet. 2006;15:3436–3445. doi: 10.1093/HMG/DDL421. [DOI] [PubMed] [Google Scholar]
- 30.Chabrol E., Popescu C., Gourfinkel-An I., Trouillard O., Depienne C., Senechal K., Baulac M., LeGuern E., Baulac S. Two Novel Epilepsy-Linked Mutations Leading to a Loss of Function of LGI1. Arch. Neurol. 2007;64:217–222. doi: 10.1001/ARCHNEUR.64.2.217. [DOI] [PubMed] [Google Scholar]
- 31.Di Bonaventura C., Operto F.F., Busolin G., Egeo G., D’Aniello A., Vitello L., Smaniotto G., Furlan S., Diani E., Michelucci R., et al. Low penetrance and effect on protein secretion of LGI1 mutations causing autosomal dominant lateral temporal epilepsy. Epilepsia. 2011;52:1258–1264. doi: 10.1111/J.1528-1167.2011.03071.X. [DOI] [PubMed] [Google Scholar]
- 32.Dazzo E., Leonardi E., Belluzzi E., Malacrida S., Vitiello L., Greggio E., Tosatto S.C.E., Nobile C. Secretion-Positive LGI1 Mutations Linked to Lateral Temporal Epilepsy Impair Binding to ADAM22 and ADAM23 Receptors. PLoS Genet. 2016;12 doi: 10.1371/JOURNAL.PGEN.1006376. [DOI] [PMC free article] [PubMed] [Google Scholar]
- 33.de Bellescize J., Boutry N., Chabrol E., André-Obadia N., Arzimanoglou A., Leguern E., Baulac S., Calender A., Ryvlin P., Lesca G. A novel three base-pair LGI1 deletion leading to loss of function in a family with autosomal dominant lateral temporal epilepsy and migraine-like episodes. Epilepsy Res. 2009;85:118–122. doi: 10.1016/J.EPLEPSYRES.2009.02.007. [DOI] [PubMed] [Google Scholar]
- 34.Sankaranarayanan S., De Angelis D., Rothman J.E., Ryan T.A. The use of pHluorins for optical measurements of presynaptic activity. Biophys. J. 2000;79:2199–2208. doi: 10.1016/S0006-3495(00)76468-X. [DOI] [PMC free article] [PubMed] [Google Scholar]
- 35.Ganguly A., Sharma R., Boyer N.P., Wernert F., Phan S., Boassa D., Parra L., Das U., Caillol G., Han X., et al. Clathrin packets move in slow axonal transport and deliver functional payloads to synapses. Neuron. 2021;109:2884–2901.e7. doi: 10.1016/J.NEURON.2021.08.016. [DOI] [PMC free article] [PubMed] [Google Scholar]
- 36.de Juan-Sanz J., Holt G.T., Schreiter E.R., de Juan F., Kim D.S., Ryan T.A. Axonal Endoplasmic Reticulum Ca2+Content Controls Release Probability in CNS Nerve Terminals. Neuron. 2017;93 doi: 10.1016/j.neuron.2017.01.010. [DOI] [PMC free article] [PubMed] [Google Scholar]
- 37.Ashrafi G., Wu Z., Farrell R.J., Ryan T.A. GLUT4 Mobilization Supports Energetic Demands of Active Synapses. Neuron. 2017;93:606–615.e3. doi: 10.1016/j.neuron.2016.12.020. [DOI] [PMC free article] [PubMed] [Google Scholar]
- 38.Bae J.R., Lee W., Jo Y.O., Han S., Koh S., Song W.K., Kim S.H. Distinct synaptic vesicle recycling in inhibitory nerve terminals is coordinated by SV2A. Prog. Neurobiol. 2020;194 doi: 10.1016/j.pneurobio.2020.101879. [DOI] [PubMed] [Google Scholar]
- 39.van Oostrum M., Campbell B., Seng C., Müller M., tom Dieck S., Hammer J., Pedrioli P.G.A., Földy C., Tyagarajan S.K., Wollscheid B. Surfaceome dynamics reveal proteostasis-independent reorganization of neuronal surface proteins during development and synaptic plasticity. Nat. Commun. 2020;11:4990. doi: 10.1038/s41467-020-18494-6. [DOI] [PMC free article] [PubMed] [Google Scholar]
- 40.Grieves R.M., Wood E.R., Dudchenko P.A. Place cells on a maze encode routes rather than destinations. Elife. 2016;5 doi: 10.7554/ELIFE.15986. [DOI] [PMC free article] [PubMed] [Google Scholar]
- 41.Neher E. Vesicle Pools and Ca2+ Microdomains: New Tools for Understanding Their Roles in Neurotransmitter Release. Neuron. 1998;20:389–399. doi: 10.1016/S0896-6273(00)80983-6. [DOI] [PubMed] [Google Scholar]
- 42.Pulido C., Ryan T.A. Synaptic vesicle pools are a major hidden resting metabolic burden of nerve terminals. Sci. Adv. 2021;7 doi: 10.1126/sciadv.abi9027. [DOI] [PMC free article] [PubMed] [Google Scholar]
- 43.Ibata K., Kono M., Narumi S., Motohashi J., Kakegawa W., Kohda K., Yuzaki M. Activity-Dependent Secretion of Synaptic Organizer Cbln1 from Lysosomes in Granule Cell Axons. Neuron. 2019;102:1184–1198.e10. doi: 10.1016/J.NEURON.2019.03.044. [DOI] [PubMed] [Google Scholar]
- 44.Verhage M., Sørensen J.B. SNAREopathies: Diversity in Mechanisms and Symptoms. Neuron. 2020;107:22–37. doi: 10.1016/j.neuron.2020.05.036. [DOI] [PubMed] [Google Scholar]
- 45.Tüshaus J., Müller S.A., Kataka E.S., Zaucha J., Sebastian Monasor L., Su M., Güner G., Jocher G., Tahirovic S., Frishman D., et al. An optimized quantitative proteomics method establishes the cell type-resolved mouse brain secretome. EMBO J. 2020;39 doi: 10.15252/EMBJ.2020105693. [DOI] [PMC free article] [PubMed] [Google Scholar]
- 46.Puntman D.C., Arora S., Farina M., Toonen R.F., Verhage M. Munc18-1 is essential for neuropeptide secretion in neurons. J. Neurosci. 2021;41:5980–5993. doi: 10.1523/JNEUROSCI.3150-20.2021. [DOI] [PMC free article] [PubMed] [Google Scholar]
- 47.Baudin P., Cousyn L., Navarro V. The LGI1 protein: molecular structure, physiological functions and disruption-related seizures. Cell. Mol. Life Sci. 2021;79:16. doi: 10.1007/S00018-021-04088-Y. [DOI] [PMC free article] [PubMed] [Google Scholar]
- 48.Fukata Y., Hirano Y., Miyazaki Y., Yokoi N., Fukata M. Trans-synaptic LGI1–ADAM22–MAGUK in AMPA and NMDA receptor regulation. Neuropharmacology. 2021;194 doi: 10.1016/J.NEUROPHARM.2021.108628. [DOI] [PubMed] [Google Scholar]
- 49.Owuor K., Harel N.Y., Englot D.J., Hisama F., Blumenfeld H., Strittmatter S.M. LGI1-associated epilepsy through altered ADAM23-dependent neuronal morphology. Mol. Cell. Neurosci. 2009;42:448–457. doi: 10.1016/J.MCN.2009.09.008. [DOI] [PMC free article] [PubMed] [Google Scholar]
- 50.Balaji J., Ryan T.A. Single-vesicle imaging reveals that synaptic vesicle exocytosis and endocytosis are coupled by a single stochastic mode. Proc. Natl. Acad. Sci. USA. 2007;104:20576–20581. doi: 10.1073/pnas.0707574105. [DOI] [PMC free article] [PubMed] [Google Scholar]
- 51.Shen Y., Wen Y., Sposini S., Vishwanath A.A., Abdelfattah A.S., Schreiter E.R., Lemieux M.J., de Juan-Sanz J., Perrais D., Campbell R.E. Rational Engineering of an Improved Genetically Encoded pH Sensor Based on Superecliptic pHluorin. ACS Sens. 2023;8:3014–3022. doi: 10.1021/acssensors.3c00484. [DOI] [PubMed] [Google Scholar]
- 52.Loh K.H., Stawski P.S., Draycott A.S., Udeshi N.D., Lehrman E.K., Wilton D.K., Svinkina T., Deerinck T.J., Ellisman M.H., Stevens B., et al. Proteomic Analysis of Unbounded Cellular Compartments: Synaptic Clefts. Cell. 2016;166:1295–1307.e21. doi: 10.1016/j.cell.2016.07.041. [DOI] [PMC free article] [PubMed] [Google Scholar]
- 53.Hivert B., Marien L., Agbam K.N., Faivre-Sarrailh C. ADAM22 and ADAM23 modulate the targeting of the Kv1 channel-associated protein LGI1 to the axon initial segment. J. Cell Sci. 2019;132 doi: 10.1242/jcs.219774. [DOI] [PubMed] [Google Scholar]
- 54.Liu A., Huang X., He W., Xue F., Yang Y., Liu J., Chen L., Yuan L., Xu P. pHmScarlet is a pH-sensitive red fluorescent protein to monitor exocytosis docking and fusion steps. Nat. Commun. 2021;12:1413. doi: 10.1038/s41467-021-21666-7. [DOI] [PMC free article] [PubMed] [Google Scholar]
- 55.Zhang Y., Rózsa M., Liang Y., Bushey D., Wei Z., Zheng J., Reep D., Broussard G.J., Tsang A., Tsegaye G., et al. Fast and sensitive GCaMP calcium indicators for imaging neural populations. Nature. 2023;615:884–891. doi: 10.1038/s41586-023-05828-9. [DOI] [PMC free article] [PubMed] [Google Scholar]
- 56.Boillot M., Lee C.Y., Allene C., Leguern E., Baulac S., Rouach N. LGI1 acts presynaptically to regulate excitatory synaptic transmission during early postnatal development. Sci. Rep. 2016 doi: 10.1038/srep21769. [DOI] [PMC free article] [PubMed] [Google Scholar]
- 57.Schulte U., Thumfart J.O., Klöcker N., Sailer C.A., Bildl W., Biniossek M., Dehn D., Deller T., Eble S., Abbass K., et al. The Epilepsy-Linked Lgi1 Protein Assembles into Presynaptic Kv1 Channels and Inhibits Inactivation by Kvβ1. Neuron. 2006;49:697–706. doi: 10.1016/J.NEURON.2006.01.033. [DOI] [PubMed] [Google Scholar]
- 58.Aggarwal A., Liu R., Chen Y., Ralowicz A.J., Bergerson S.J., Tomaska F., Mohar B., Hanson T.L., Hasseman J.P., Reep D., et al. Glutamate indicators with improved activation kinetics and localization for imaging synaptic transmission. Nat. Methods. 2023;20:925–934. doi: 10.1038/s41592-023-01863-6. [DOI] [PMC free article] [PubMed] [Google Scholar]
- 59.Kim S.H., Ryan T.A. CDK5 serves as a major control point in neurotransmitter release. Neuron. 2010;67:797–809. doi: 10.1016/j.neuron.2010.08.003. [DOI] [PMC free article] [PubMed] [Google Scholar]
- 60.Piatkevich K.D., Jung E.E., Straub C., Linghu C., Park D., Suk H.J., Hochbaum D.R., Goodwin D., Pnevmatikakis E., Pak N., et al. A robotic multidimensional directed evolution approach applied to fluorescent voltage reporters. Nat. Chem. Biol. 2018;14:352–360. doi: 10.1038/S41589-018-0004-9. [DOI] [PMC free article] [PubMed] [Google Scholar]
- 61.Milosevic M.M., Jang J., McKimm E.J., Zhu M.H., Antic S.D. In Vitro Testing of Voltage Indicators: Archon1, ArcLightD, ASAP1, ASAP2s, ASAP3b, Bongwoori-Pos6, BeRST1, FlicR1, and Chi-VSFP-Butterfly. eNeuro. 2020;7:1–19. doi: 10.1523/ENEURO.0060-20.2020. [DOI] [PMC free article] [PubMed] [Google Scholar]
- 62.Hoppa M.B., Gouzer G., Armbruster M., Ryan T.A. Control and plasticity of the presynaptic action potential waveform at small CNS nerve terminals. Neuron. 2014;84:778–789. doi: 10.1016/J.NEURON.2014.09.038. [DOI] [PMC free article] [PubMed] [Google Scholar]
- 63.Cho I.H., Panzera L.C., Chin M., Alpizar S.A., Olveda G.E., Hill R.A., Hoppa M.B. The potassium channel subunit K v β1 serves as a major control point for synaptic facilitation. Proc. Natl. Acad. Sci. USA. 2020;117:29937–29947. doi: 10.1073/PNAS.2000790117. [DOI] [PMC free article] [PubMed] [Google Scholar]
- 64.Borst J.G., Sakmann B. Calcium influx and transmitter release in a fast CNS synapse. Nature. 1996;383:431–434. doi: 10.1038/383431a0. [DOI] [PubMed] [Google Scholar]
- 65.Hoppa M.B., Lana B., Margas W., Dolphin A.C., Ryan T.A. α2δ expression sets presynaptic calcium channel abundance and release probability. Nature. 2012;486:122–125. doi: 10.1038/nature11033. [DOI] [PMC free article] [PubMed] [Google Scholar]
- 66.Prüss H. Autoantibodies in neurological disease. Nat. Rev. Immunol. 2021;21:798–813. doi: 10.1038/s41577-021-00543-w. [DOI] [PMC free article] [PubMed] [Google Scholar]
- 67.Dalmau J., Geis C., Graus F. Autoantibodies to synaptic receptors and neuronal cell surface proteins in autoimmune diseases of the central nervous system. Physiol. Rev. 2017;97:839–887. doi: 10.1152/PHYSREV.00010.2016/ASSET/IMAGES/LARGE/Z9J0021728010021.JPEG. [DOI] [PMC free article] [PubMed] [Google Scholar]
- 68.Pan Y., Monje M. Activity Shapes Neural Circuit Form and Function: A Historical Perspective. J. Neurosci. 2020;40:944–954. doi: 10.1523/JNEUROSCI.0740-19.2019. [DOI] [PMC free article] [PubMed] [Google Scholar]
- 69.Biederer T., Kaeser P.S., Blanpied T.A. Transcellular Nanoalignment of Synaptic Function. Neuron. 2017;96:680–696. doi: 10.1016/J.NEURON.2017.10.006. [DOI] [PMC free article] [PubMed] [Google Scholar]
- 70.Chen H., Tang A.H., Blanpied T.A. Subsynaptic spatial organization as a regulator of synaptic strength and plasticity. Curr. Opin. Neurobiol. 2018;51:147–153. doi: 10.1016/J.CONB.2018.05.004. [DOI] [PMC free article] [PubMed] [Google Scholar]
- 71.Glebov O.O., Cox S., Humphreys L., Burrone J. Neuronal activity controls transsynaptic geometry. Sci. Rep. 2016:22703–22711. doi: 10.1038/srep22703. [DOI] [PMC free article] [PubMed] [Google Scholar]
- 72.Alle H., Roth A., Geiger J.R.P. Energy-efficient action potentials in hippocampal mossy fibers. Science (New York, N.Y.) 2009;325:1405–1408. doi: 10.1126/science.1174331. [DOI] [PubMed] [Google Scholar]
- 73.Li H.L., van Rossum M.C. Energy efficient synaptic plasticity. Elife. 2020;9 doi: 10.7554/ELIFE.50804. [DOI] [PMC free article] [PubMed] [Google Scholar]
- 74.Niven J.E., Laughlin S.B. Energy limitation as a selective pressure on the evolution of sensory systems. J. Exp. Biol. 2008;211:1792–1804. doi: 10.1242/JEB.017574. [DOI] [PubMed] [Google Scholar]
- 75.Yu L., Yu Y. Energy-efficient neural information processing in individual neurons and neuronal networks. J. Neurosci. Res. 2017;95:2253–2266. doi: 10.1002/jnr.24131. [DOI] [PubMed] [Google Scholar]
- 76.Ashrafi G., de Juan-Sanz J., Farrell R.J., Ryan T.A. Molecular Tuning of the Axonal Mitochondrial Ca2+ Uniporter Ensures Metabolic Flexibility of Neurotransmission. Neuron. 2020;105:678–687.e5. doi: 10.1016/j.neuron.2019.11.020. [DOI] [PMC free article] [PubMed] [Google Scholar]
- 77.Rangaraju V., Calloway N., Ryan T.A. Activity-driven local ATP synthesis is required for synaptic function. Cell. 2014;156:825–835. doi: 10.1016/j.cell.2013.12.042. [DOI] [PMC free article] [PubMed] [Google Scholar]
- 78.Dittman J.S., Kreitzer A.C., Regehr W.G. Interplay between facilitation, depression, and residual calcium at three presynaptic terminals. J. Neurosci. 2000;20:1374–1385. doi: 10.1523/JNEUROSCI.20-04-01374.2000. [DOI] [PMC free article] [PubMed] [Google Scholar]
- 79.O’Rourke N.A., Weiler N.C., Micheva K.D., Smith S.J. Deep Molecular Diversity of Mammalian Synapses: Why It Matters and How to Measure It. Nat. Rev. Neurosci. 2012;13:365–379. doi: 10.1038/NRN3170. [DOI] [PMC free article] [PubMed] [Google Scholar]
- 80.Ariel P., Hoppa M.B., Ryan T.A. Intrinsic variability in Pv, RRP size, Ca(2+) channel repertoire, and presynaptic potentiation in individual synaptic boutons. Front. Synaptic Neurosci. 2012;4:9. doi: 10.3389/fnsyn.2012.00009. [DOI] [PMC free article] [PubMed] [Google Scholar]
- 81.Karlocai M.R., Heredi J., Benedek T., Holderith N., Lorincz A., Nusser Z. Variability in the munc13-1 content of excitatory release sites. Elife. 2021;10 doi: 10.7554/ELIFE.67468. [DOI] [PMC free article] [PubMed] [Google Scholar]
- 82.Sun T., Qiao H., Pan P.-Y., Chen Y., Sheng Z.-H. Motile Axonal Mitochondria Contribute to the Variability of Presynaptic Strength. Cell Rep. 2013;4:413–419. doi: 10.1016/J.CELREP.2013.06.040. [DOI] [PMC free article] [PubMed] [Google Scholar]
- 83.Sik A., Tamamaki N., Freund T.F. Complete Axon Arborization of a Single CA3 Pyramidal Cell in the Rat Hippocampus, and its Relationship With Postsynaptic Parvalbumin-containing Interneurons. Eur. J. Neurosci. 1993;5:1719–1728. doi: 10.1111/J.1460-9568.1993.TB00239.X. [DOI] [PubMed] [Google Scholar]
- 84.Branco T., Staras K. The probability of neurotransmitter release: variability and feedback control at single synapses. Nat. Rev. Neurosci. 2009;10:373–383. doi: 10.1038/nrn2634. [DOI] [PubMed] [Google Scholar]
- 85.Rudenko G. Dynamic Control of Synaptic Adhesion and Organizing Molecules in Synaptic Plasticity. Neural Plast. 2017;2017 doi: 10.1155/2017/6526151. [DOI] [PMC free article] [PubMed] [Google Scholar]
- 86.Bajar B.T., Wang E.S., Lam A.J., Kim B.B., Jacobs C.L., Howe E.S., Davidson M.W., Lin M.Z., Chu J. Improving brightness and photostability of green and red fluorescent proteins for live cell imaging and FRET reporting. Sci. Rep. 2016;6 doi: 10.1038/srep20889. [DOI] [PMC free article] [PubMed] [Google Scholar]
- 87.Persoon C.M., Moro A., Nassal J.P., Farina M., Broeke J.H., Arora S., Dominguez N., van Weering J.R., Toonen R.F., Verhage M. Pool size estimations for dense-core vesicles in mammalian CNS neurons. EMBO J. 2018;37 doi: 10.15252/embj.201899672. [DOI] [PMC free article] [PubMed] [Google Scholar]
- 88.Chow B.Y., Han X., Dobry A.S., Qian X., Chuong A.S., Li M., Henninger M.A., Belfort G.M., Lin Y., Monahan P.E., Boyden E.S. High-performance genetically targetable optical neural silencing by light-driven proton pumps. Nature. 2010;463:98–102. doi: 10.1038/nature08652. [DOI] [PMC free article] [PubMed] [Google Scholar]
- 89.Reya T., Duncan A.W., Ailles L., Domen J., Scherer D.C., Willert K., Hintz L., Nusse R., Weissman I.L. A role for Wnt signalling in self-renewal of haematopoietic stem cells. Nature. 2003;423:409–414. doi: 10.1038/nature01593. [DOI] [PubMed] [Google Scholar]
- 90.Schneider C.A., Rasband W.S., Eliceiri K.W. NIH Image to ImageJ: 25 years of image analysis. Nat. Methods. 2012;9:671–675. doi: 10.1038/nmeth.2089. [DOI] [PMC free article] [PubMed] [Google Scholar]
- 91.Chi P., Greengard P., Ryan T.A. Synapsin dispersion and reclustering during synaptic activity. Nat. Neurosci. 2001;4:1187–1193. doi: 10.1038/nn756. [DOI] [PubMed] [Google Scholar]
- 92.Sposini S., Rosendale M., Claverie L., Van T.N.N., Jullié D., Perrais D. Imaging endocytic vesicle formation at high spatial and temporal resolutions with the pulsed-pH protocol. Nat. Protoc. 2020;15:3088–3104. doi: 10.1038/s41596-020-0371-z. [DOI] [PubMed] [Google Scholar]
- 93.Haselmann H., Mannara F., Werner C., Planagumà J., Miguez-Cabello F., Schmidl L., Grünewald B., Petit-Pedrol M., Kirmse K., Classen J., et al. Human Autoantibodies against the AMPA Receptor Subunit GluA2 Induce Receptor Reorganization and Memory Dysfunction. Neuron. 2018;100:91–105.e9. doi: 10.1016/j.neuron.2018.07.048. [DOI] [PubMed] [Google Scholar]
Associated Data
This section collects any data citations, data availability statements, or supplementary materials included in this article.
Supplementary Materials
Data Availability Statement
-
•
Data reported in this paper will be shared by the lead contact upon request.
-
•
This paper does not report original code.
-
•
Any additional information required to reanalyze the data reported in this paper is available from the lead contact upon request.