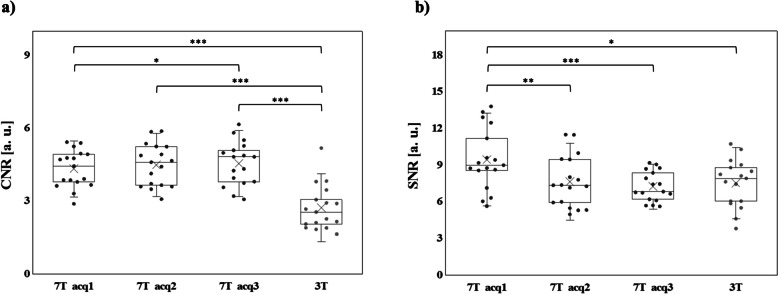
Fig. 2.
CNR (a) and SNR (b) calculated for the three 7-T TOF-MRA sequences at different spatial resolutions (black color) and for the clinical 3-T TOF-MRA images (dark gray color). Each dot represents the mean among subjects of CNR (a) or SNR (b) for a specific ROI. Data distribution is shown through box plots, where the box is determined by the 25th and 75th percentiles and the median and the mean are represented by the horizontal and the cross line inside the box, respectively. The whiskers represent the 5th and 95th percentiles. To compare results for CNR (a) or SNR (b) obtained by different acquisitions, nonparametric paired tests (Wilcoxon signed-rank test) were performed between each couple of datasets. Statistically significant differences of CNR and SNR between different acquisition schemes are reported in the graph according to the following legend: one asterisk (*) indicates p < 0.050, two asterisks (**) p < 0.010, and three asterisks (***) p < 0.001. CNR Contrast-to-noise ratio, SNR Signal-to-noise ratio, TOF-MRA Time-of-flight magnetic resonance angiography

