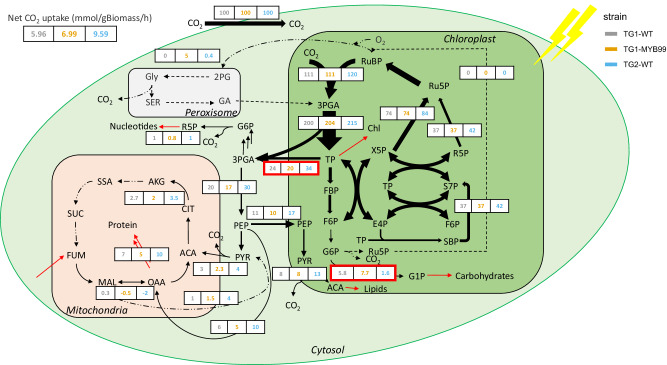
Fig. 3. Flux maps determined in TG1, TG1-MYB99, and TG2 under continuous HL conditions (1000 µE).
For each reaction shown, the net fluxes are normalized to 100 units of CO2 taken up. All flux values and confidence intervals are given in Supplementary Data 4. Estimated net CO2 uptake rates for TG1, TG1-MYB99, and TG2 are 5.96, 6.99, and 9.59 mmol gBiomass-1 h-1 respectively (derived from flux models, using n = 3 biological replicated experiments). Ribulose 1,5-bisphosphate (RuBP), 3-phosphoglycerate (3PGA), Triose phosphate (TP), Fructose 1,6-bisphosphate (FBP), Fructose 6-phosphate (F6P), Glucose 6-phosphate (G6P), Glucose 1-phosphate (G1P), Ribulose 5-phosphate (Ru5P), Erythrose 4-phosphate (E4P), Ribose 5-phosphate (R5P), Xylulose 5-phosphate (X5P), Sedoheptulose-7-phosphate (S7P), Sedoheptulose-1,7-bisphosphate (SBP), Phosphoenolpyruvate (PEP), Acetyl-CoA (ACA), Pyruvate (PYR), Glycine (Gly), Serine (SER), 2-phosphoglycolate (2PG), Glycolic acid (GA), Citrate (CIT), Alpha-ketoglutarate (AKG), Succinic semialdehyde (SSA), Succinate (SUC), Fumarate (FUM), Malate (MAL), Oxaloacetate (OAA). Black arrows represent intracellular flux while red arrows represent fluxes to/from biomass sink. The width of the black arrows is indicative of the magnitude of the flux. The red boxes highlight reactions catalyzed by phosphoglucomutase (PGM) and triose phosphate transporter (TPT3) which are implicated in the differing biomass composition phenotypes.

