
Fig. 3. Transcription factor binding analysis.
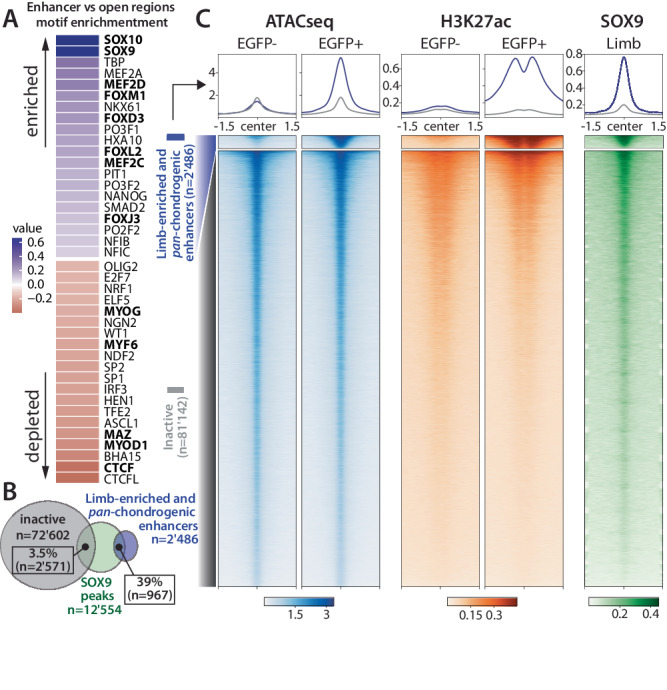
A Log2 fold-change of motif enrichment between chondrogenic enhancers and “inactive” accessible regions for the top 20 motifs enriched and depleted. B Overlap of SOX9 binding peaks40 with limb-enriched and pan-chondrogenic enhancers (n = 2'486) compared to “inactive” accessible regions (see Fig. 2A). For better comparison between enhancers and inactive regions, the latter were merged when closer than 500 bp (n = 72'602). C Binding densities of SOX940 at limb-enriched and pan-chondrogenic enhancers compared to inactive accessible regions (see Fig. 2A). Heatmaps are generated from the limb EGFP+ and EGFP- datasets. ATAC-seq, H3K27ac and SOX9 coverages over 3 kb centered at the corresponding merged ATAC-seq peaks located within a 75 bp window.