
Fig. 1. Superfluid speed in a JJN.
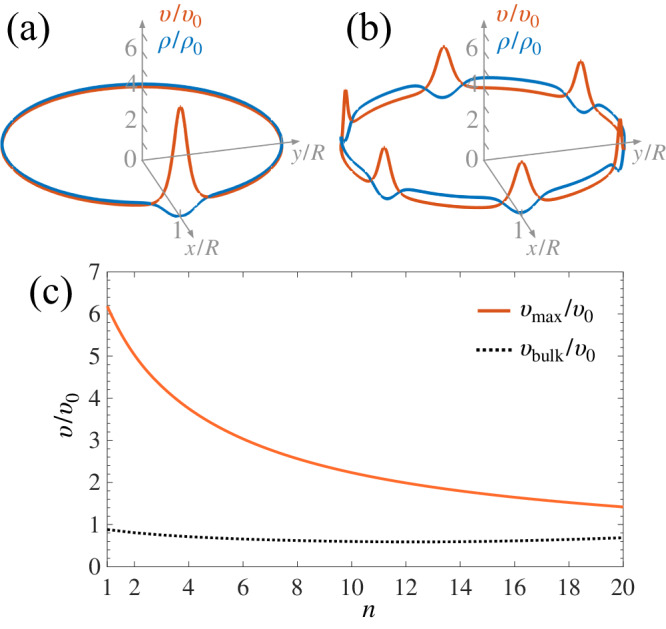
a, b show the superfluid density ρ (blue line) and speed υ (orange line) in a 1D JJN, divided by the values ρ0 and υ0, respectively, of the homogeneous ring. The two panels correspond to n = 1 (a) and n = 6 (b) junctions. c Maximum, (solid orange line), and bulk, υbulk (dotted black line), superfluid speed as a function of the number of junctions. Results in all panels are obtained from the stationary states of the 1D GPE with w = 1 and Ω = 0.