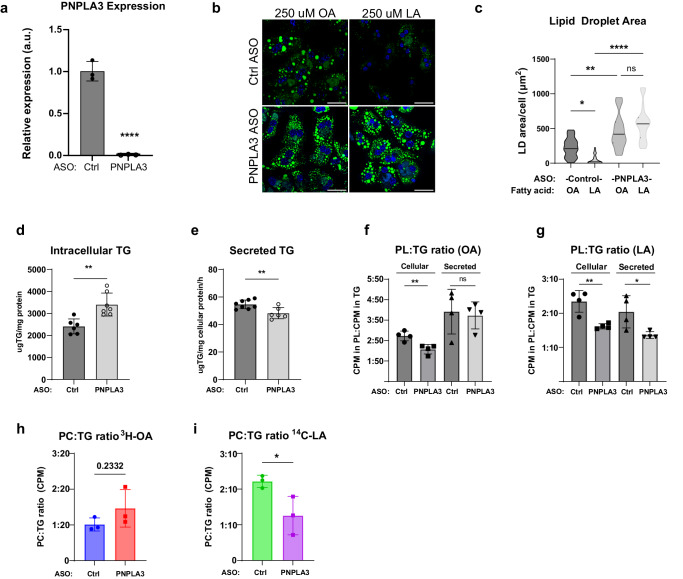
Fig. 6. PNPLA3 mediates PUFA mobilization from intracellular TG to secreted PL.
a qPCR of PNPLA3 expression in primary hepatocytes transfected with control or PNPLA3 ASO (n = 3/group). b BODIPY staining of LDs in cells after 4 h of lipid deprivation in high glucose medium following treatment with 250 μM OA or LA in low glucose medium. c Quantification of LD area in (b). Primary hepatocytes were pretreated with a mixture of unlabeled 125 μM OA + 125 μM LA (n = 8/ASO group). Following 24 h in FA-free media, lipids were extracted from cells (d) and conditioned media (e) for quantitative TG analysis. Primary hepatocytes were pretreated with a mixture of unlabeled 125 μM OA + 125 μM LA containing either 3H-OA or 14C-LA. After a 24-h chase period, cellular and secreted lipids were analyzed for the ratio of 3H-OA (f) or 14C-LA (g) in PL vs TG (n = 4/group). Primary hepatocytes were pretreated with either 125 μM of unlabeled OA containing 3H-OA (h) or 125 μM of unlabeled LA containing 14C-LA (i). After a 24 h chase period, secreted lipids were analyzed for ratio of radioactivity in PL vs.TG (n = 3/group). Scale bar = 50 μm. Box-plot elements: center line, median; box limits, upper and lower quartiles. Data presented as mean ± SD *p < 0.05, **p < 0.01, ****p < 0.0001, two-sided t test. Specific p values: c (Ctrl ASO) OA vs LA, p = 2.23E-06; (PNPLA3 ASO) OA vs LA, p = 0.177; (OA) Ctrl ASO vs PNPLA3 ASO, p = 0.00239; (LA) Ctrl ASO vs PNPLA3 ASO, p < 1E-10. d p = 0.00213. e p = 0.00666. f Cellular, p = 0.00775; Secreted, p = 0.783. g Cellular, p = 0.00437; Secreted, p = 0.0300. i p = 0.0424.

