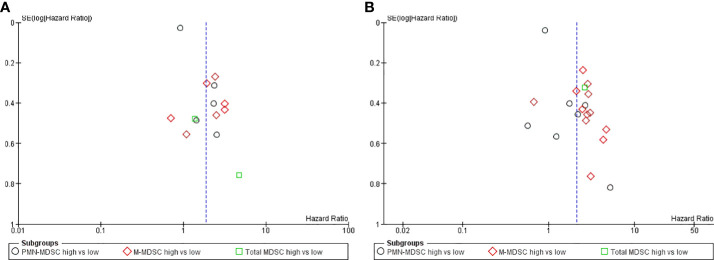
Figure 5.
(A) Funnel plot progression free survival: Assessing the publication bias, the hazard ratio was plotted on the X-axis and the standard error corresponding to the logarithm of hazard ratio on the Y-axis. (B) Funnel plot overall survival: Assessing the publication bias, the hazard ratio was plotted on the X-axis and the standard error corresponding to the logarithm of hazard ratio on the Y-axis.

