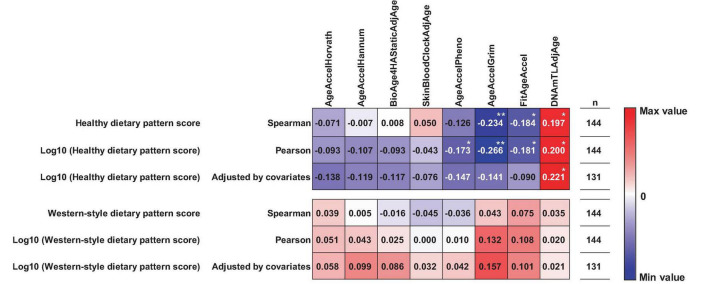
FIGURE 2.
Correlations between dietary patterns and epigenetic clocks. The values in the figure represent correlation and partial correlation coefficients. Partial correlation analysis was performed adjusted for body mass index (BMI), smoking and drinking status, exercise habit, and socioeconomic factors, such as marital status, education status, and income level. AgeAccel, age acceleration; AdjAge, age adjusted values; TL, telomere length. Significant correlations at p < 0.05 and p < 0.01 are indicated by * and **.

