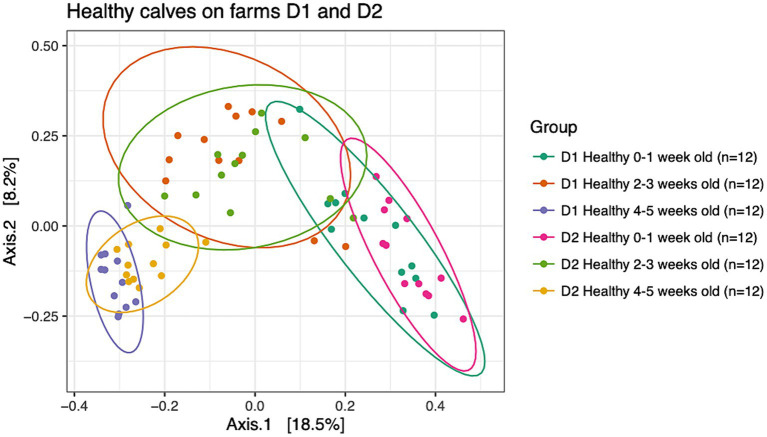
Figure 2.
Principal coordinate analysis (PCoA) based on Bray-Curtis compositional dissimilarity of the bacterial 16S rRNA gene sequence data for fecal samples collected from healthy calves on farms D1 (n = 12) and D2 (n = 12) at 0–1, 2–3, and 4–5 weeks old. The proportion of variance explained by each principal coordinate axis is expressed by the corresponding axis label. Points represent individual samples. Samples that are more similar to one another appear closer together. The ellipses represent a 95% confidence interval calculated based on a t-distribution.

