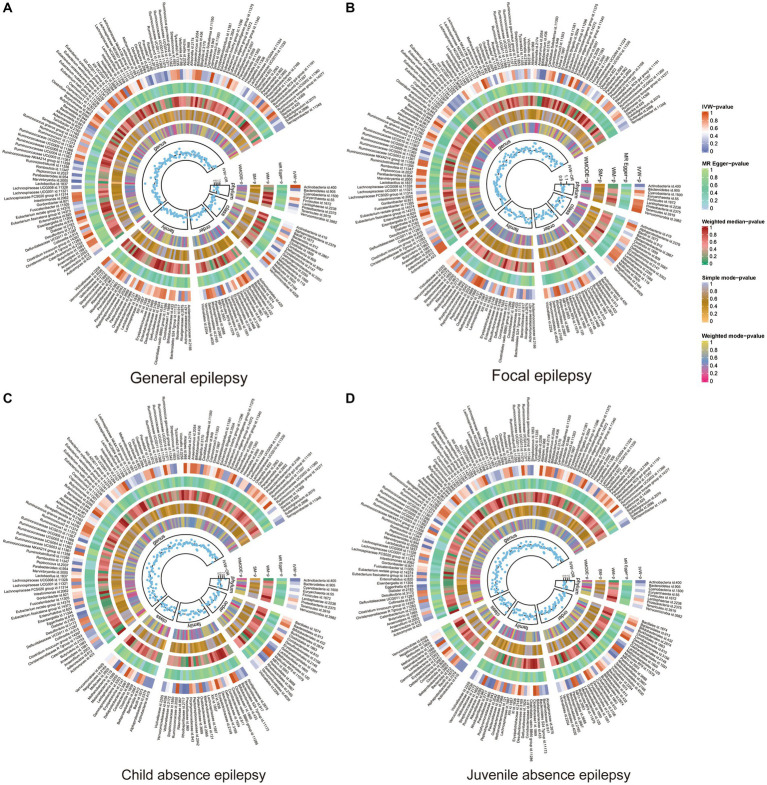
Figure 2.
Heat map of GM taxa causally associated with subtypes of epilepsy. Red represents risk factors, while blue represents protective factors. (A) Heat map of GM taxa causally associated with GE; (B) Heat map of GM taxa causally associated with FE; (C) Heat map of GM taxa causally associated with CAE; (D) Heat map of GM taxa causally associated with JAE. GM, gut microbiome; IVW, inverse-variance weighted method; WM, weighted median; OR, odds ratios; SM, simple mode; WMODE, weighted mode.

