Figure 3.
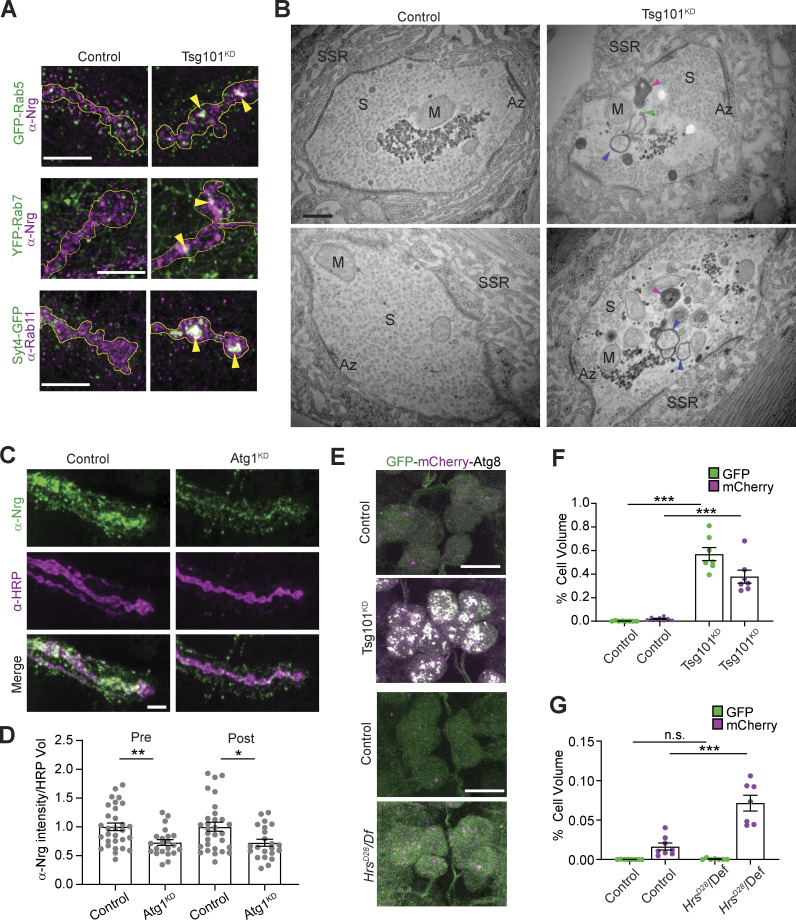
Loss of ESCRT causes compensatory autophagy of presynaptic cargoes. (A) Representative Airyscan images showing co-localization of EV cargoes Syt4-GFP or α-Nrg with endosomal markers α-Rab11, GFP-Rab5 (endogenous tag), or YFP-Rab7 (endogenous tag). Scale bars are 5 μm and the outline represents the neuronal membrane as marked from an HRP mask. (B) Representative TEM images of boutons from muscle 6/7 from control and neuronal Tsg101KD larvae. Examples of autophagic vacuoles are marked with arrowheads, blue = autophagosome, magenta = autolysosome, and green = unclosed phagophore. Other notable features include Az = active zone, S = synaptic vesicles, M = mitochondria, SSR = subsynaptic reticulum. Scale bar is 400 nm. (C) Representative images of the EV cargo Nrg following motor neuron knockdown of Atg1. Scale bar is 5 μm. (D) Quantification of Nrg intensity from C, normalized to control. (E) Representative images from neuronal cell bodies in the ventral ganglion expressing motor neuron-driven GFP-mCherry-Atg8. Scale bar is 10 μm. Brightness/contrast are matched for each mutant with its paired control (see Table S3). (F and G) Quantification of GFP-mCherry-Atg8 levels in F Tsg101KD and (G) HrsD28 mutant larvae. Data are represented as mean ± SEM; n represents NMJs in C and animals in F and G. *P < 0.05, **P < 0.01, ***P < 0.001. See Tables S1 and S3 for detailed genotypes, sample sizes, and statistical analyses.

