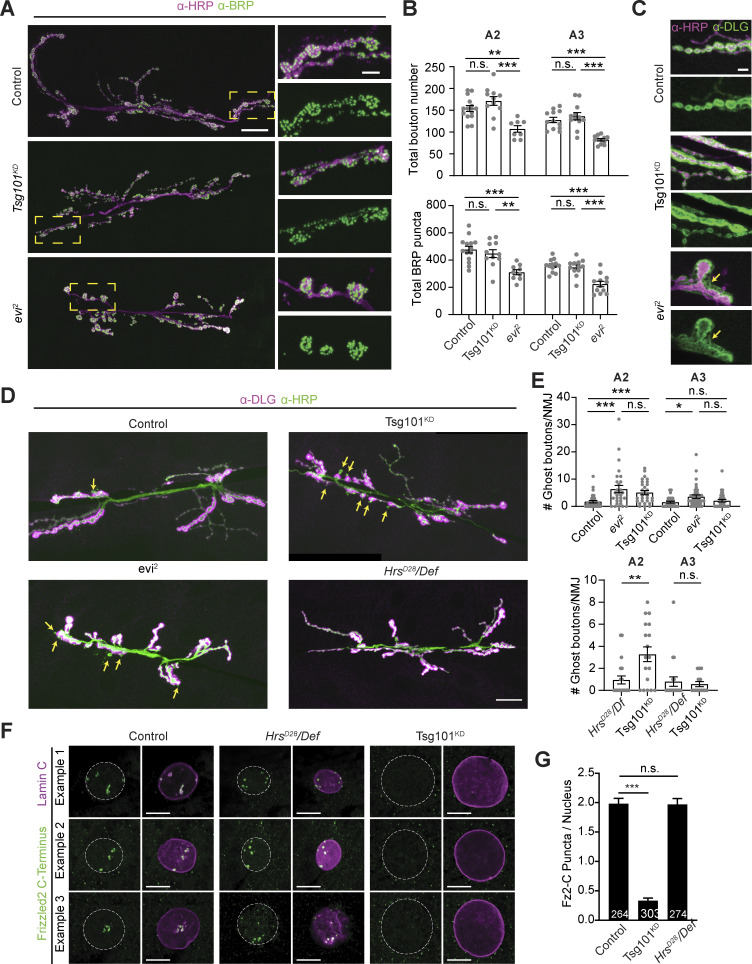
Figure 5.
Tsg101KD phenocopies a subset of evi and wg synaptic morphology and signaling defects, while loss of Hrs has no effect. (A) Representative confocal images of muscle 6/7 NMJs labeled with α-HRP and α-BRP antibodies (left). Magnification of the yellow boxed area (right). HRP brightness was adjusted independently. Large image scale bar is 20 µm, small image scale bar is 5 µm. (B) Quantification of total bouton number (top) and active zone number (bottom) on muscle 6/7. (C) Representative confocal images of muscle 6/7 NMJ highlighting α-DLG pattern. Arrows indicate the location of “feathery” DLG. Scale bar is 5 µm. (D) Representative confocal images of muscle 6/7 NMJ (abdominal segment A2) labeled with α-HRP and α-DLG antibodies. α-DLG and α-HRP signals were acquired in the linear range but adjusted independently and displayed near saturation to highlight DLG-negative ghost boutons, which are indicated with yellow arrows. (E) Quantification of baseline (i.e., unstimulated) ghost boutons. Top and bottom graphs represent independent experiments. (F) Single slices of muscle 6/7 nuclei labeled with α-LamC (nuclear periphery) and α-Fz2-C antibodies. Dotted line represents LamC-defined nuclear boundary. Scale bars are 10 µm. (G) Quantification of Fz2-C puncta per nucleus. Number of nuclei quantified is indicated in the bar graph. A2 and A3 indicate the larval abdominal segment. Data are represented as mean ± SEM; n represents nuclei in G and NMJs in B–E. *P < 0.05, **P < 0.01, ***P < 0.001. See Tables S1 and S3 for detailed genotypes, sample sizes, and statistical analyses.

