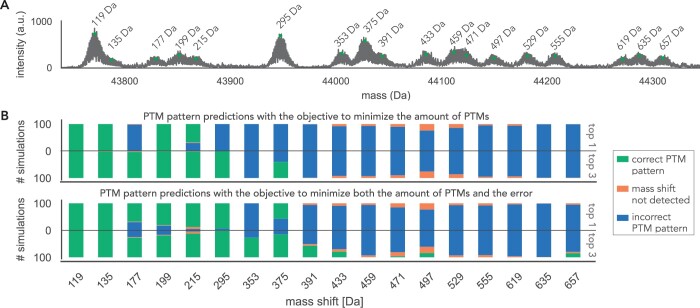
Figure 5.
Evaluation of PTM pattern predictions for a complex PTM pattern landscape. (A) Basal noise and vertical and horizontal error are added to the complex PTM pattern spectrum. The respective PTM patterns are listed in the Supplementary Table S3. (B) The mass spectrum is generated 100 times, once to evaluate MSModDetector using the objective function to minimize the number of PTMs, and once using the objective to minimize both the number of PTMs and the error between inferred and observed mass shift. For each objective function, we show how often the correct PTM pattern is predicted considering only the first optimal solution or the three optimal solutions.

