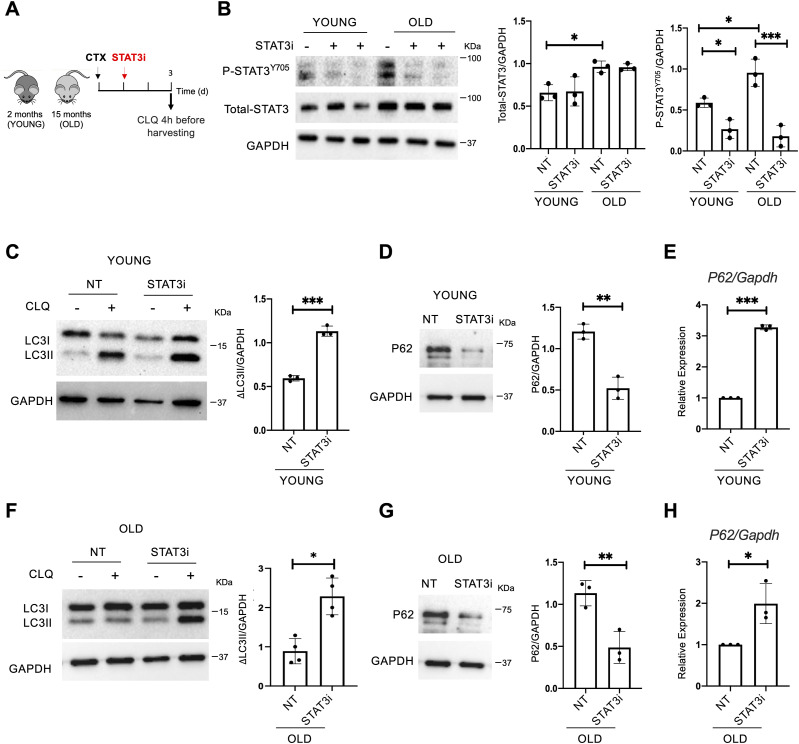
Figure 1. STAT3 inhibition activates autophagy in young and old regenerating muscles.
(A) Schematic representation of skeletal muscle injury and STAT3i treatment in 2 (young)- or 15 (old)-month-old C57BL/6J WT mice. To assess the autophagic flux, CLQ was administered 4 h before harvesting. (B) Phospho-STAT3Y705 (P-STAT3Y705), total STAT3, and GAPDH protein expression in young or old uninjured muscles. Plots represent the total STAT3/GAPDH ratio and the P-STAT3Y705/GAPDH ratio (n = 3; values represent the mean ± s.d., *P < 0.05 and ***P < 0.001 by one-way ANOVA). (C) LC3 protein expression in young injured WT mice analyzed at 3 d.p.i. The plot represents the relative change in the LC3II/GAPDH ratio between CLQ-treated and not treated samples (ΔLC3II/GAPDH) (n = 3; values represent the mean ± s.d., ***P < 0.001 by a t test). (D) P62 protein expression in young mice not treated (NT) or treated with the STAT3i. The plot represents the p62/GAPDH ratio (n = 3; values represent the mean ± s.d., **P < 0.01 by a t test). (E) qRT–PCR for p62 normalized for Gapdh in young mice not treated (NT) or treated with the STAT3i (n = 3; values represent the mean ± s.d., ***P < 0.001 by a t test). (F) LC3 protein expression in old injured WT mice analyzed at 3 d.p.i. The plot represents the ΔLC3II/GAPDH ratio (n = 4; values represent the mean ± s.d., *P < 0.05 by a t test). (G) P62 protein expression in old mice not treated (NT) or treated with the STAT3i. The plot represents the p62/GAPDH ratio (n = 3; values represent the mean ± s.d., **P < 0.01 by a t test). (H) qRT–PCR for p62 normalized for Gapdh in old mice not treated (NT) or treated with the STAT3i (n = 3; values represent the mean ± s.d., *P < 0.05 by a t test).
Source data are available for this figure.

