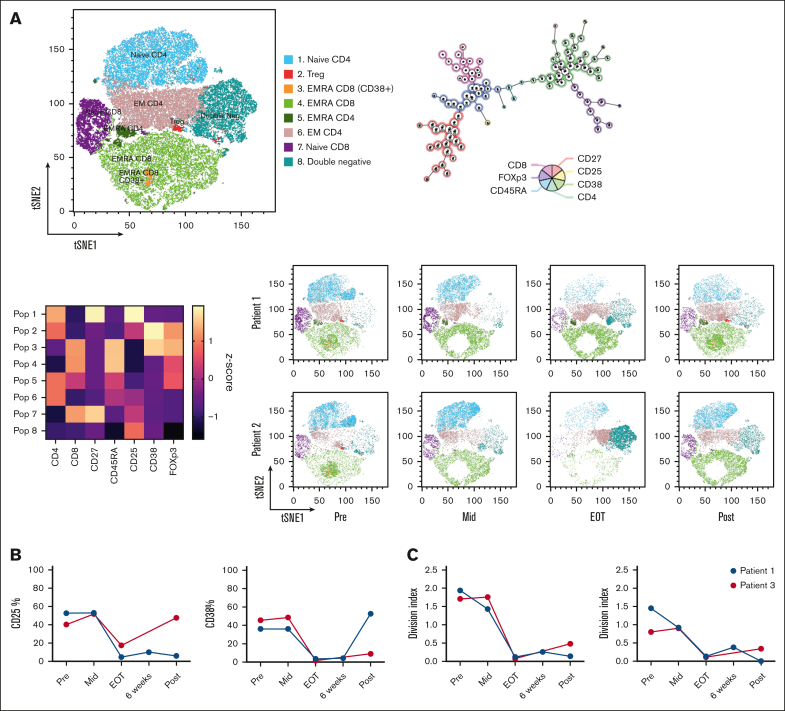
Figure 3.
T-cell function and populations altered by daratumumab treatment. (A) Pooled tSNE map, minimal spanning tree, and heat map of the 8 FlowSOM metaclusters based on marker intensity, followed by tSNE maps of metaclusters in individual patients over treatment course: baseline (Pre), during treatment (Mid), immediately after treatment cessation (EOT), 6 weeks after the last cycle (6 weeks) and 3 months after end of treatment (Post). (B) Expression of CD25, CD38 on CD4+ T cells measured after a 48-hour T-cell stimulation. (C) Samples were stained with CTV and proliferation was assessed after 5 days of T-cell stimulation. CM, central memory; CTV, cell trace violet; EM, effector memory; EMRA, effector memory RA+; Treg, T-regulatory.

