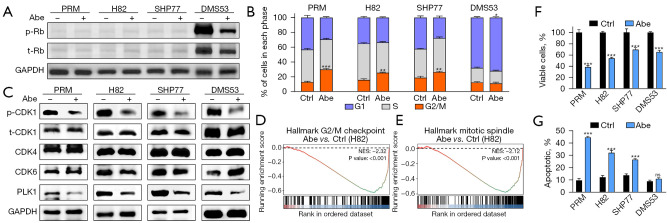
Figure 1.
The anti-tumor effects of abemaciclib in SCLC. (A) Western blots showing the protein expression of p- and t-Rb in SCLC cells treated with 1 µM abemaciclib for 24 h. (B) Cell cycle states of SCLC cells treated with 1 µM abemaciclib for 24 h as detected by PI-based flow cytometry. (C) Western blots showing the protein expression of p- and t-CDK1, CDK4, CDK6 and PLK1 in SCLC cells treated with 1 µM abemaciclib for 24 h. (D,E) In H82 cells treated with abemaciclib, gene sets for G2/M checkpoint and mitotic spindle were significantly downregulated. The y-axis represents enrichment score and the x-axis are genes (vertical black lines) represented in gene sets. The colored band at the bottom represents the degree of correlation of genes with the abemaciclib treatment (red for positive and blue for negative correlation). (F) Cell viability of SCLC cells treated with 1 µM abemaciclib for 5 days as measured by CCK8 cell viability assay. (G) Apoptotic proportion of SCLC cells treated with 1 µM abemaciclib for 24 h as detected by annexin V-PI-based flow cytometry. The statistical analysis was performed using two-tailed unpaired Student’s t-test. P values are shown and error bars indicate mean ± SD. *, P<0.05; **, P<0.01; ***, P<0.001; ns, no significance. Abe, abemaciclib; p-, phospho-; t-, total-; Rb, retinoblastoma; ctrl, control; NES, normalized enrichment score; SCLC, small cell lung cancer; PI, propidium iodide; PLK1, polo-like kinase 1; CCK8, Cell Counting Kit 8; SD, standard deviation.

